


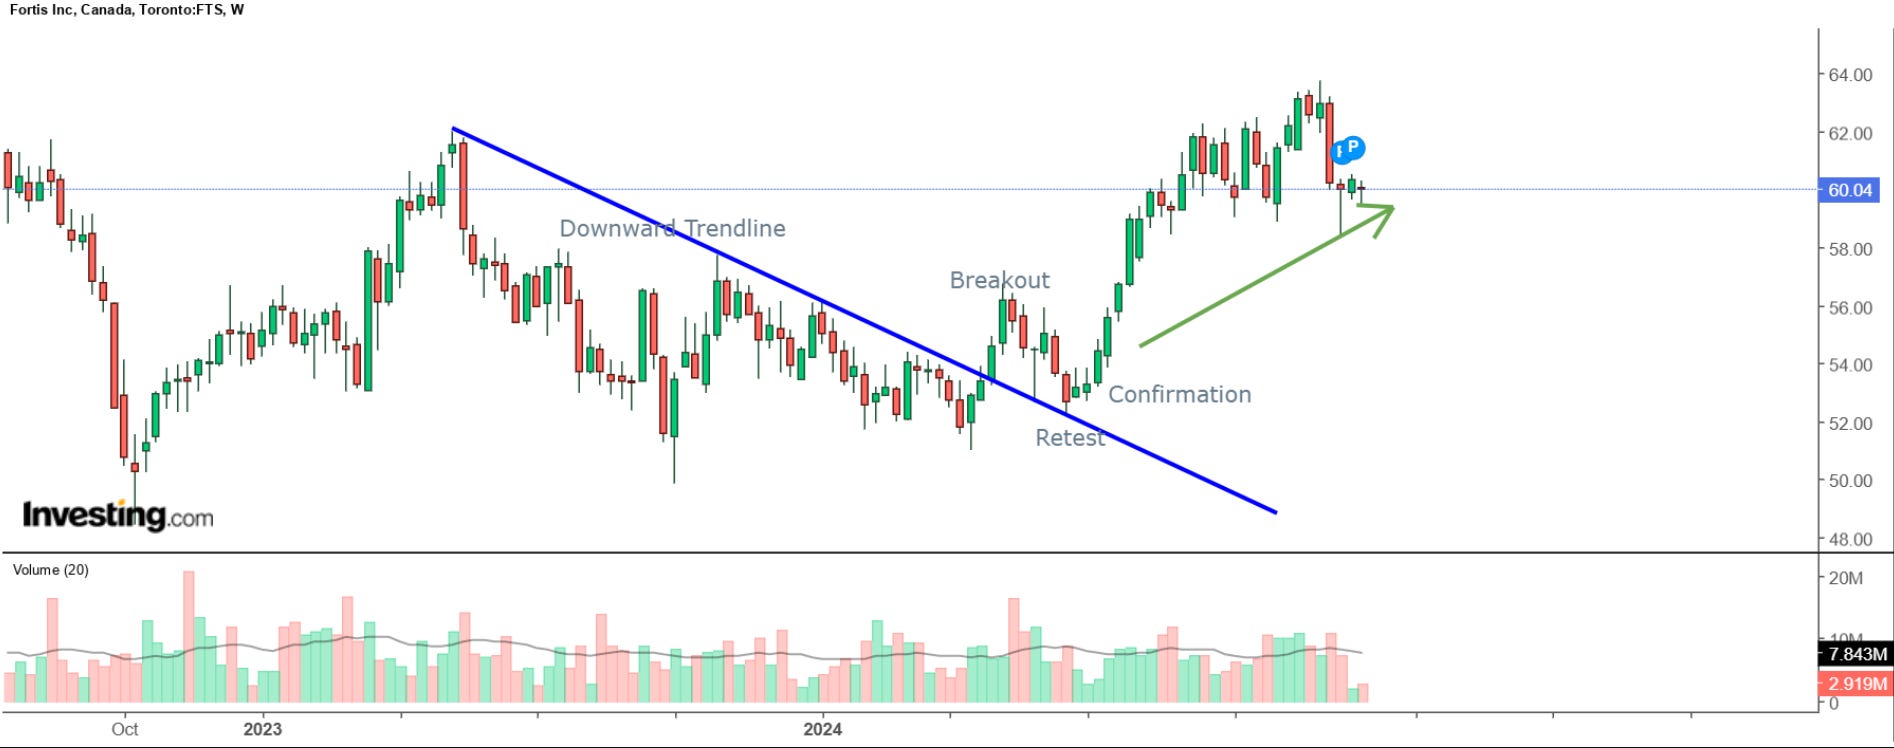
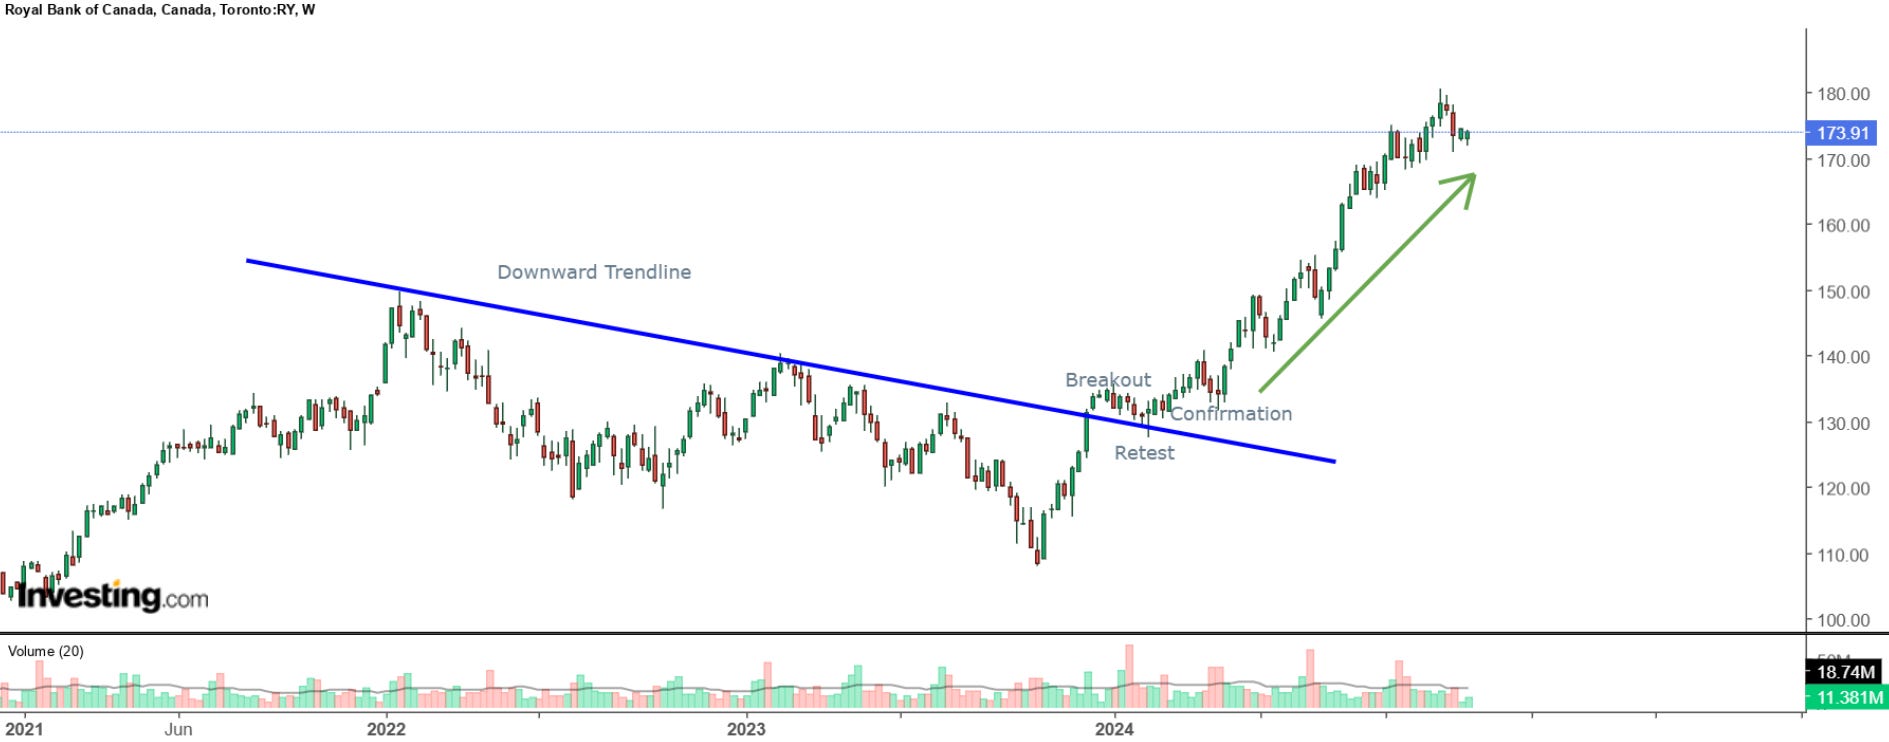
A breakout from a long downtrend in stocks is often referred to as a bullish breakout or a reversal breakout. Alternative terms for this pattern include downtrend breakout and resistance breakout.
Downward Trend: In a downtrend, prices are generally falling. A falling trendline connects a series of lower highs on the price chart.
Breakout: When the price moves decisively above this falling trendline, it signals a potential shift in market sentiment from bearish to bullish.
Both of these types of breakouts signal a potential shift in sentiment from bearish to bullish. In other words, it suggests a reversal of the existing downtrend, potentially leading to a new uptrend.
What to look out for?
Break Above Resistance: The stock price breaks above a key resistance level (often a previous high or a descending trend line) that had been preventing upward movement.
Increased Volume: Typically accompanied by an increase in trading volume, indicating strong buying pressure.
Confirmation: Often confirmed by a subsequent pullback to retest the breakout level and then continuing the upward move.
It is important to note that while a bullish breakout is a positive sign, it doesn't guarantee a sustained uptrend.
Furthermore, investors may tend to dollar-cost average (DCA) during a downtrend, but if the downtrend persists, they may continue this strategy and miss out on upside opportunities. In some cases, a breakout can indicate a bottom, whether for a short-term or long-term move, serving as a potential signal to add to positions. However, various other factors can influence this outcome.
Usually, the longer the trend line is, the more reliable it can be in confirming stock technicals because they incorporate more data points and reduce the impact of short-term price fluctuations and noise.
Illustrations
Enbridge (ENB)

Fortis (FTS)
Visa (V)

Royal Bank (RY)
Potential Breakouts
Canadian National Railway (CNR)
CNR has been in a long-standing consolidation phase since 2021. After reaching an all-time high in December 2022, it entered a downtrend that signaled a breakout in November 2023, with confirmation following shortly after. It then achieved a new all-time high in March 2024. Since then, it has been on a downward trajectory with no signs of a breakout. Although it appears undervalued at the moment, this downtrend may persist if it fails to break through the trendline.

Telus (T)
Telecommunications companies, especially in Canada, have been hammered. This chart can be tricky. Since reaching its all-time highs in April 2022, Telus has been under pressure, as evidenced by its downward spiral. Although it appears to have broken out and is now in retest territory, another downward trend is visible, represented by the red line, though with a less steep slope. Telus seems like a decent short-term addition at this point, but if it can break through the red line, it may instill more confidence in investors for a true long-term breakout.

Tetra Technologies Inc. (TTI)
This is an instance where the trendline can be applied twice within a short period of time. The longer downward trendline began in March 2021, broke out in October 2024, retested in November 2024, and then climbed to a high later that month. From there, it experienced another downward slope, and we are currently seeing the potential start of another breakout. Keep an eye on this one.

Disclaimer: The information provided is for educational and informational purposes only. It does not constitute financial advice or a recommendation to buy, sell, or hold any specific stocks or securities.

Consider joining DiviStock Chronicles’ Referral Program for more neat rewards!Please refer to the details of the referral program.