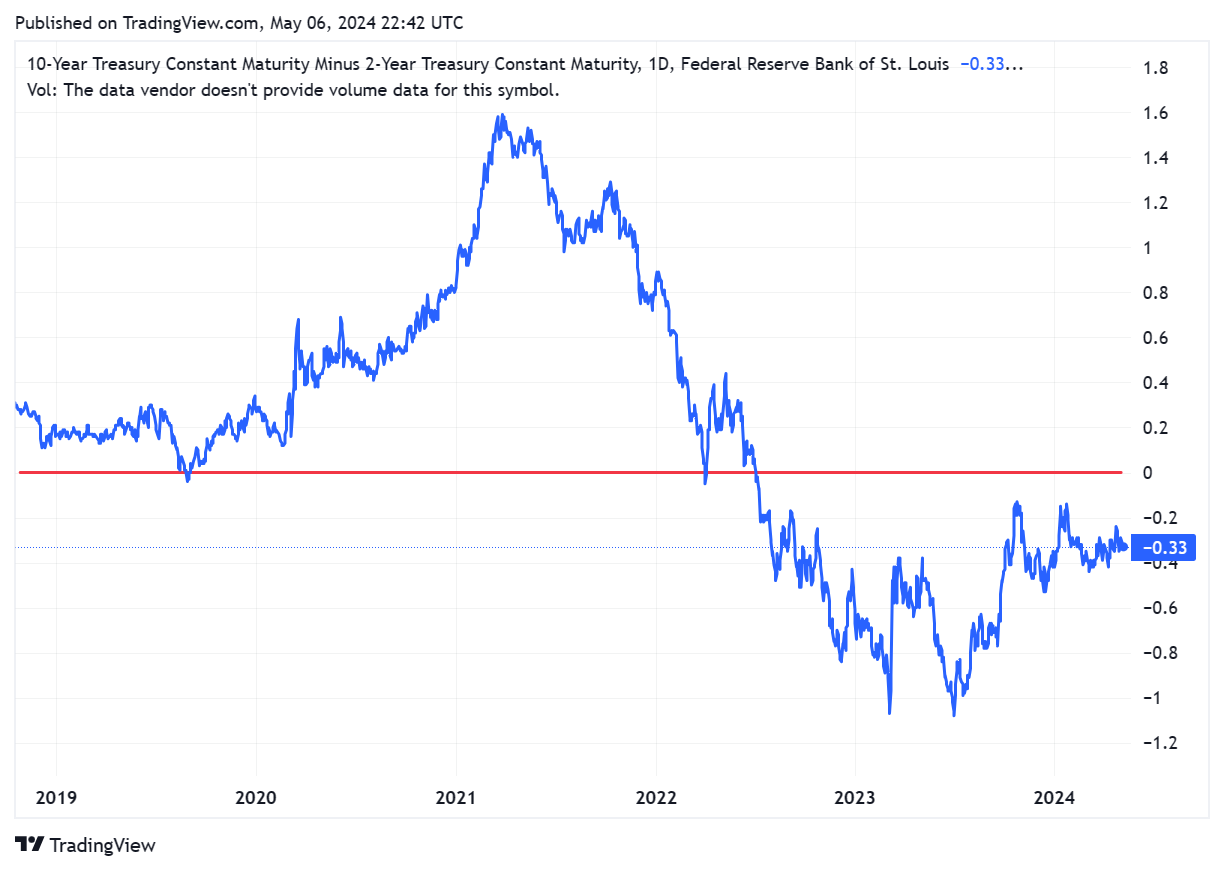
An inverted yield curve occurs when long-term interest rates are lower than short-term interest rates. The most popular comparison is between the ten-year and two-year bond yields. Positive values may imply future growth, negative values may imply economic downturns.
The yield curve has now been continuously inverted since July 5, 2022. That makes over 670 days. If this was the Olympics, this would earn you the gold medal along with the title of all-time world record holder. So is a recession near? Statistical evidence screams yes, but will this time be different? The time lag between inversion and a recession is usually 14-18 months so we must be close. Right?

Historical Context
Between 1962 and 2018, there have been several cases of inversion. A total of nine inversions occurred during this period, with only two instances that did not lead to a recession. All other instances led to a recession down the line with an average lag time of 14 months. Put that into a percentage, 77% of the time a recession occurred. Those are not good probabilities for the economy.
Longest Time of Inverted Yield Curve
1929 - Great Depression
Inversion lasted between December 1927 to November 1929
From the start of inversion, markets rallied 100% until the start of the market crash in October 1929
Why? Interestingly, in the 1929 period, the stock market experienced a significant rise as unemployment rates were minimal, and a sense of optimism was widespread. Yet, in May 1929, the yield curve started to experience a sharp incline, leading to a stock market collapse in the following months that signaled the onset of the Great Depression.
The economic downturn continued until about 1939, making it the longest and most severe depression ever experienced by the industrialized Western world.
1974 - Stagflation
Inversion lasted between March 1973 to January 1975
This was quite the opposite of what happened in 1929. The market topped in January 1973 and began falling until bottoming out in October 1974. An approximate 50% crash.
Why? Many factors ultimately led to the crash, most notably the spike in oil prices.
2008 - Great Recession
Inversion lasted between July 2006 to January 2008
From the start of inversion, markets rallied 30% until October 2007 and then proceeded its downward trend, an approximate 55% drop until bottoming out in March 2009.
Why? A housing bubble as a result of easy credit and subprime mortgages. Massive risk-taking by global financial institutions, among a lack of regulation. Excessive risk-taking, excessive borrowing. All in all, a collapse ensued.
Conclusion
Since the inversion began in July 2022, the market has ripped up about 40%. It has corrected a bit over the last few months but is now trending back up. Is this the last rally before the big downturn? If the market top was indeed in April 2024, it certainly was one of the longest uptrends, if not the longest, since an inversion start. If the upward trend does not break that high, I expect more choppy movement until the big correction.
Once the yield curve becomes ‘uninverted’, expect some big swings to the downside. But this may even occur before that. Unfortunately, something will have to break.


