


For individuals seeking to learn about analyzing Exchange-Traded Funds (ETFs), I suggest reviewing my earlier post that explains the fundamentals of ETFs and the analysis process.
Analyzing an ETF

An Exchange-Traded Fund (ETF) serves as both an investment product and a collective investment scheme. Let’s break down what this entails:
Invesco S&P 500 Equal Weight ETF (RSP) - Snapshot
Overview
The Invesco S&P 500 Equal Weight ETF (RSP)1 is a passively managed exchange-traded fund (ETF) launched on April 24, 2003, designed to track the S&P 500 Equal Weight Index. Unlike traditional market-cap-weighted ETFs like SPY, RSP equally weights each of the 500 constituent stocks in the S&P 500, providing balanced exposure across all companies regardless of their market capitalization. This approach reduces concentration risk associated with mega-cap stocks and tilts exposure toward smaller companies within the S&P 500, offering a diversified investment vehicle for large-cap U.S. equities.
Investment Strategy
RSP employs a full replication methodology, investing at least 90% of its total assets in the securities that comprise the S&P 500 Equal Weight Index. The index equally weights each stock, resulting in approximately 0.2% allocation per company, rebalanced quarterly to maintain this structure. This equal-weight strategy mitigates the dominance of larger companies, providing greater exposure to mid-cap and smaller large-cap stocks compared to market-cap-weighted indices. The approach embodies a contrarian theme, as quarterly rebalancing involves selling outperformers and buying underperformers, potentially enhancing returns when smaller companies outperform larger ones. The fund focuses on the Large Cap Blend segment, aiming to deliver returns reflective of the broader U.S. equity market with reduced concentration risk.
Top Holdings
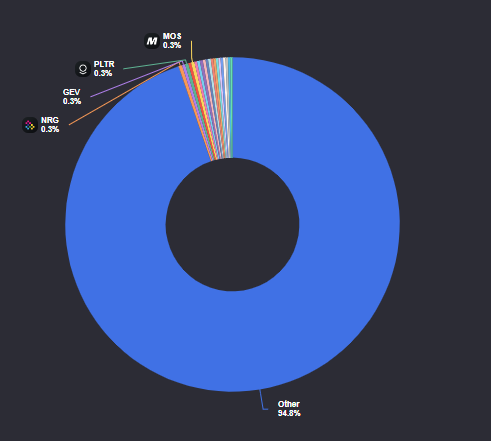
RSP's top holdings demonstrate its-weight methodology, ensuring that no single stock dominates the portfolio. Each stock constitutes approximately 0.24% to 0.26% the portfolio, thereby maintaining the neutrality depicted in the pie chart below.
Sector Allocation
The equal-weight strategy prevents any single sector from exerting dominance, unlike market-cap-weighted indices, where technology often commands a substantial share. While the fund’s sector allocation closely resembles that of the S&P 500, it reduces concentration in top-heavy industries. As illustrated below, the larger technology weighting is more evenly distributed across a broader range of sectors, ensuring a more balanced exposure.

Risk Level
MEDIUM-to-HIGH - due to its 100% equity allocation, with no bonds or fixed-income securities to cushion market downturns. RSP’s risk profile is comparable to other large-cap blend ETFs, with a few distinctions due to its equal-weight strategy. The fund’s emphasis on smaller S&P 500 companies increases its beta (volatility relative to the market), as mid-cap stocks tend to be more volatile than mega-cap stocks.
Performance
Since its inception on April 24, 2003, through March 31, 2025, RSP has delivered an annualized return of 10.86% at net asset value (NAV), slightly outperforming the S&P 500 Index’s 10.76% over the same period.
Expense Ratio
RSP has a Management Expense Ratio (MER) of 0.20%. This low cost enhances its appeal for cost-conscious investors, as it reduces the impact of fees on long-term returns.
This means that for every $1,000 invested, the annual cost would be $2.00.
Dividend Yield
RSP has an average dividend yield of 1%-2%. Dividends are paid quarterly.
This means that if you invest $1,000 in this ETF, you can expect to receive approximately $10 to $20 in dividends over a year, assuming the yield remains constant.
Similar Alternatives
Below are similar alternative ETFs to RSP that either employ an equal-weight strategy, focus on large-cap blend equities, or provide diversified exposure to U.S. markets with comparable objectives:
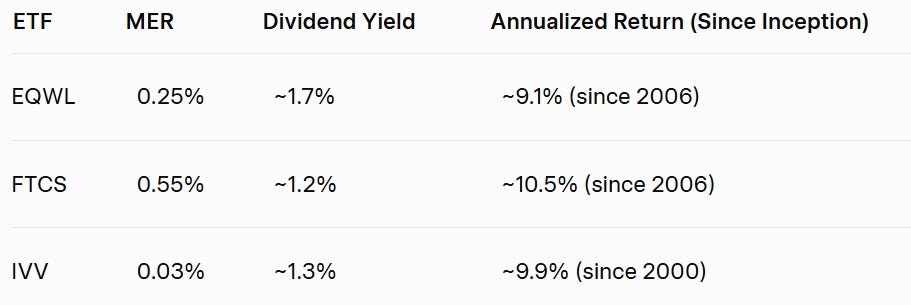
Invesco S&P 100 Equal Weight ETF (EQWL): Tracks the S&P 100 Equal Weight Index, which equally weights 100 large-cap, blue-chip U.S. companies, rebalanced quarterly to maintain a 1.0% weighting per holding.
First Trust Capital Strength ETF (FTCS): Tracks the Capital Strength Index, which selects 50 large-cap U.S. companies based on strong balance sheets, high liquidity, and consistent earnings growth, with an equal-weight approach.
iShares Core S&P 500 ETF (IVV): Tracks the market-cap-weighted S&P 500 Index, providing broad exposure to 500 large-cap U.S. stocks without equal weighting.
This is a comparison of the RSP ETF and similar alternatives, focusing on their Management Expense Ratios (MER), yields, and annualized performances.
Target Investors
The Invesco S&P 500 Equal Weight ETF (RSP) is designed for investors who want broad exposure to the S&P 500 but without the heavy concentration in mega-cap stocks like Apple and Microsoft. Here’s who might find RSP appealing:
Diversification Seekers – Unlike traditional S&P 500 ETFs that are weighted by market capitalization, RSP equally weights all 500 stocks, reducing concentration risk.
Long-Term Investors – Those who believe in equal-weight investing as a strategy to potentially outperform market-cap-weighted funds over time.
Risk-Conscious Investors – Since RSP reduces exposure to the largest companies, it may be attractive to those who want less reliance on big tech and more balanced sector exposure.
Contrarian Investors – RSP rebalances quarterly, meaning it sells winners and buys losers, which can be appealing to those who favor a contrarian approach.
Reasons to Invest in RSP
Diversification Across Sectors and Stocks: RSP gives equal weight to all 500+ companies in the S&P 500, reducing concentration risk in mega-cap stocks. This provides broader exposure to mid- and small-cap companies within the index, which may outperform during certain market cycles.
Potential for Outperformance in Value-Driven Markets: Equal-weight ETFs tend to tilt toward value stocks and smaller companies, which can outperform in environments where growth stocks (e.g., tech) underperform.
Lower Volatility in Certain Conditions: By avoiding overexposure to a few large-cap stocks, RSP can exhibit lower volatility during market downturns driven by mega-cap corrections.
Long-Term Performance Potential: Over long periods, equal-weight strategies have historically delivered higher returns than market-cap-weighted indices due to their bias toward smaller companies with higher growth potential. From 2003 to 2023, RSP’s annualized return was approximately 10.5%, competitive with the S&P 500’s 10%.
Low Expense Ratio: RSP has a low expense ratio, which is reasonable for an ETF, making it cost-effective for long-term investors seeking broad market exposure with an equal-weight twist.
Reasons Not to Invest in RSP
Underperformance in Tech-Driven Markets: RSP can lag the S&P 500 during periods when mega-cap tech stocks drive market gains. For example, in 2020 and 2023, RSP underperformed the SPDR S&P 500 ETF (SPY) due to the dominance of tech giants like Nvidia and Amazon.
Higher Turnover and Rebalancing Costs: RSP requires periodic rebalancing to maintain equal weights, leading to higher turnover than market-cap-weighted ETFs. This can result in higher transaction costs and potential tax inefficiencies for investors in taxable accounts due to capital gains distributions.
Sector and Stock Risk: While RSP reduces concentration in mega-caps, it increases exposure to smaller, potentially riskier companies within the S&P 500. During market downturns, these stocks may be more volatile or sensitive to economic conditions.
Limited International Exposure: RSP focuses solely on U.S. large-cap stocks, lacking exposure to international markets or emerging economies.
Market Timing Challenges: RSP’s performance depends on market conditions favoring value or smaller-cap stocks. Predicting when these conditions will occur is difficult, and mistiming investments could lead to underperformance compared to broader market ETFs.

Consider joining DiviStock Chronicles’ Referral Program for more neat rewards!Please refer to the details of the referral program.