


Take Three - Random Investing Notes
A collection of insightful investment pieces to broaden knowledge and elevate the investing mindset. Includes: Purchasing Power, Global Liquidity, Currency Debasement, Hurdle Rate, Liquidity Cycles.

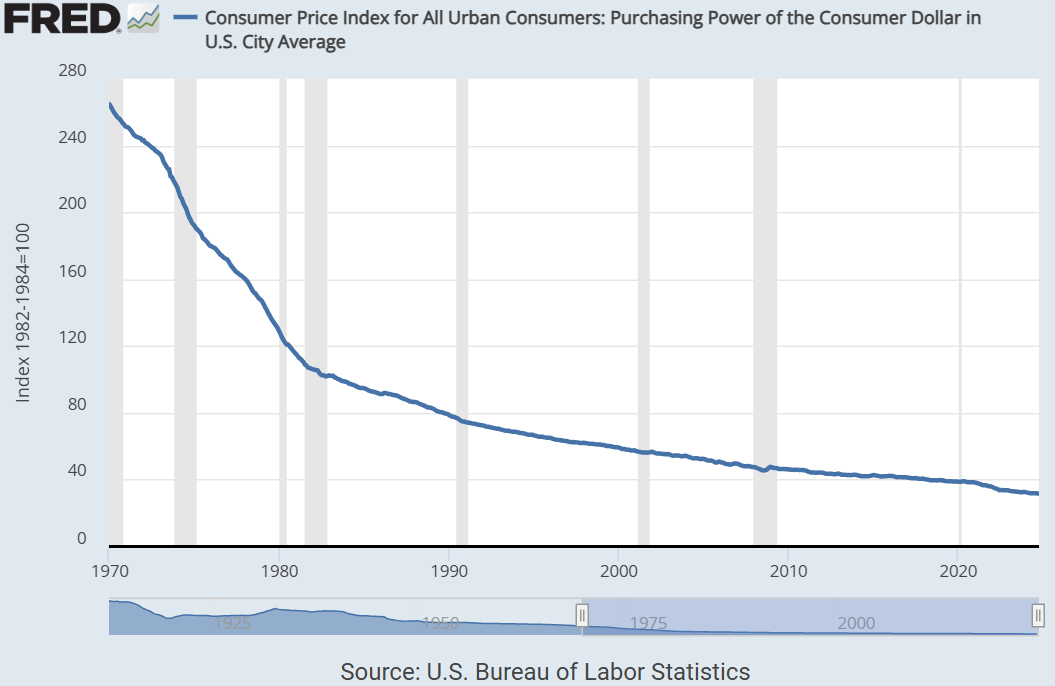
Cash Loses Value
Inflation lowers the purchasing power of your money every single year.
Inflation is a general increase in the prices of goods and services over time. It's usually measured using a consumer price index (CPI).
Consider using the inflation calculator (for Canadians) in the caption below to run some numbers.

Leaving a significant amount of money in your savings account can lead to a decrease in wealth over time due to inflation. Conversely, it's not advisable to invest all your funds in stocks either.
It's prudent to invest only the money that you won't require for the next five to ten years. A good guideline is to keep an emergency fund of at least six to twelve months' worth of living expenses in cash to cover unexpected events.
At minimum, seek out high-interest savings accounts and guaranteed investment certificates (GICs). However, shop around to find the best rate in order to beat out inflation.
Here are the average inflation rates in Canada over the past 5, 10, and 20 years:
Past 5 years: The average inflation rate has been approximately 3.89%.
Past 10 years: The average inflation rate has been around 2.49%.
Past 20 years: The average inflation rate has been about 2.20%.
Global Liquidity
Understanding global liquidity is essential for grasping the dynamics of financial markets and economic conditions. It denotes the ability to convert assets into cash swiftly without a significant impact on their price. The assessment of global liquidity encompasses various key indicators and methodologies.
A prevalent measure of global liquidity is the Global M2 money supply. This includes physical currency, checking accounts, savings deposits, money market securities, and other readily available forms of cash. It compiles data from major economies such as the United States, China, the Eurozone, among others, offering an extensive perspective on the aggregate amount of money accessible for expenditure, investment, and lending worldwide.
Correlation
Greater liquidity equates to more opportunities for investing in risk assets, which often move in tandem. Conversely, when liquidity diminishes, risk assets tend to decline. This forms a continuous cycle.
 rise and fall.")

Currency Debasement
The rate of currency debasement refers to the pace at which the value of money diminishes. The most significant instance of this is when a government decides to print additional currency. As the supply of money grows, the purchasing power of an individual typically decreases over time.
The annual average growth in M2 since the global financial crisis (GFC) in 2008 has been 6.3%.
The annual average growth in M2 in the last 10 years has been 5.8%.
The annual average growth in M2 in the last 5 years has been 6.9%.
The annual average growth in M2 in the last 3 years has been 2.3%.
Note: The "Global Money Supply - M2" data below presents the money supply figures of the four major central banks: the Federal Reserve System (Fed) of the United States, the European Central Bank (ECB), the Bank of Japan (BOJ), and the People's Bank of China (PBOC).

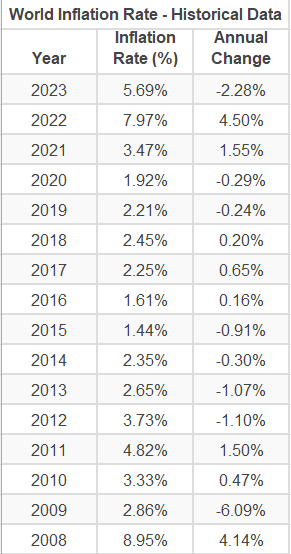
Essentially, your money is being eroded at this rate in addition to the global average inflation rate which have been depicted below:
3.6% since the GFC.
3.1% in the last 10 years.
4.2% in the last 5 years.
5.7% in the last 3 years.
What does this mean?
The hurdle rate is the minimum rate of return that a company or investor expects to achieve in an investment. In this case, the minimum expected return is INFLATION + DEBASEMENT + any additional RISK PREMIUM. The average market risk premium in the United States is around 5.5%, while in Canada it is 5.2%. Historical risk premiums have ranged from 3% to 12%.
A risk premium is the additional return an investor expects to receive for taking on a higher level of risk compared to a risk-free investment. Essentially, it's the compensation for the extra risk associated with a particular investment.
To put this into perspective, here are the minimum expected returns in each scenario assuming a conservative 3% risk premium:
Since the GFC, 6.3% + 3.6% + 3% = 12.9%
The last 10 years, 5.8% + 3.1% + 3% = 11.9%
The last 5 years, 6.9% + 4.2% + 3% = 14.1%
The last 3 years, 2.3% + 5.7% + 3% = 11.0%
Here's a breakdown of the average S&P 500 returns since the GFC and over the last 10, 5, and 3 years:
Since the GFC (2009 - 2024): The average annual return has been approximately 13.6%.
Last 10 years (2014 - 2024): The average annual return has been around 13.05%.
Last 5 years (2019 - 2024): The average annual return has been about 15.9%.
Last 3 years (2021 - 2024): The average annual return has been approximately 23.89%
The S&P 500's return has largely kept consistent, except for the last three years where it has significantly outperformed the hurdle rate amidst notable inflationary trends. Nevertheless, if your personal risk premium exceeded 3%, surpassing the hurdle rate might have been challenging unless you invested in Bitcoin or were fortunate to maintain an expertly managed portfolio.
Cyclical Liquidity Patterns
Michael Howell of Crossborder Capital suggests that global liquidity cycles follow a four-year oscillation. The chart below indicates a significant correlation. Currently, we are at the nadir of the cycle, poised for an upward trend. Should this pattern persist, the bullish phase may continue, with the peak or onset of a downturn projected for the end of 2025 into early 2026.
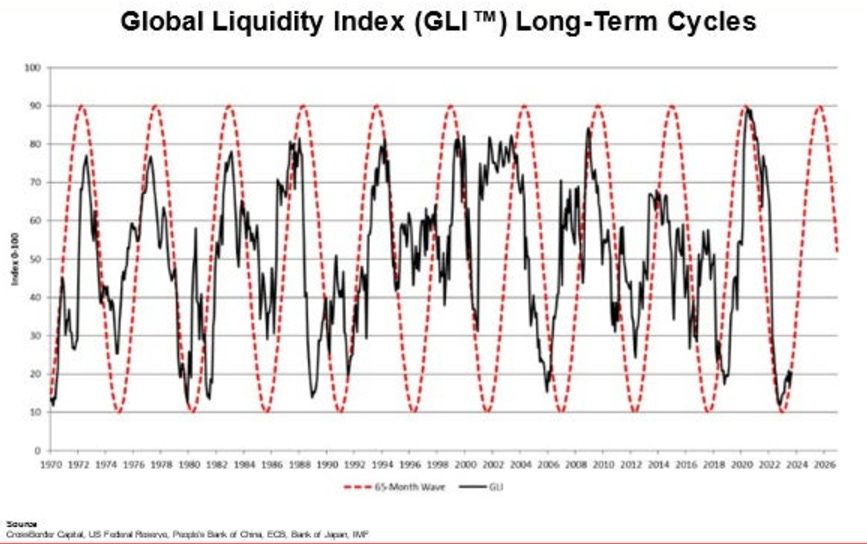
The increase in global money supply, followed by a swift decrease towards the end of four-year cycles, is further evidenced in the subsequent charts.


Should these patterns persist, 2025 could certainly mark the great melt-up while 2026 could mark the beginning of a downturn. Nevertheless, it's possible that the downturn might commence sooner. Despite this, it serves as a solid analytical indicator of future expectations.
Past Editions


Consider joining DiviStock Chronicles’ Referral Program for more neat rewards!
Please refer to the details of the referral program below.
Invite your friends to read DiviStock Chronicles

Thank you for reading DiviStock Chronicles — your support allows me to keep doing this work. Join our referral program!