


Understanding Key Terms in Canadian Banking
Understanding the Metrics Behind Canadian Banks’ Financial Health

Canadian banks employ a standardized set of financial metrics to communicate their performance to shareholders. These indicators offer insights into profitability, risk management, and financial stability. With Canada's stringent regulatory framework ensuring a resilient banking system, understanding these metrics is crucial for investors and analysts alike.
Such a regulatory frameworks is driven by two main vehicles - the international framework of the Basel III Accord (and its evolution into Basel IV), and domestic regulations enforced by the Office of the Superintendent of Financial Institutions (OSFI).
The Basel III Accord, developed by the Basel Committee on Banking Supervision (BCBS), is a global set of banking regulations introduced post-2008 financial crisis to strengthen bank capital requirements, enhance risk management, and promote financial stability.
The Office of the Superintendent of Financial Institutions (OSFI) is Canada’s primary banking regulator, responsible for implementing Basel III/IV standards while tailoring them to the Canadian financial system. OSFI’s guidelines ensure that Canadian banks, particularly the six Domestic Systemically Important Banks, maintain robust capital levels to withstand domestic and global economic shocks.
Below is a concise overview of the key terms and metrics commonly used by Canadian banks, with a focus on their public financial reporting, particularly for major banks like Royal Bank of Canada (RBC), Toronto-Dominion Bank (TD), Bank of Nova Scotia (Scotiabank), Bank of Montreal (BMO), and Canadian Imperial Bank of Commerce (CIBC).
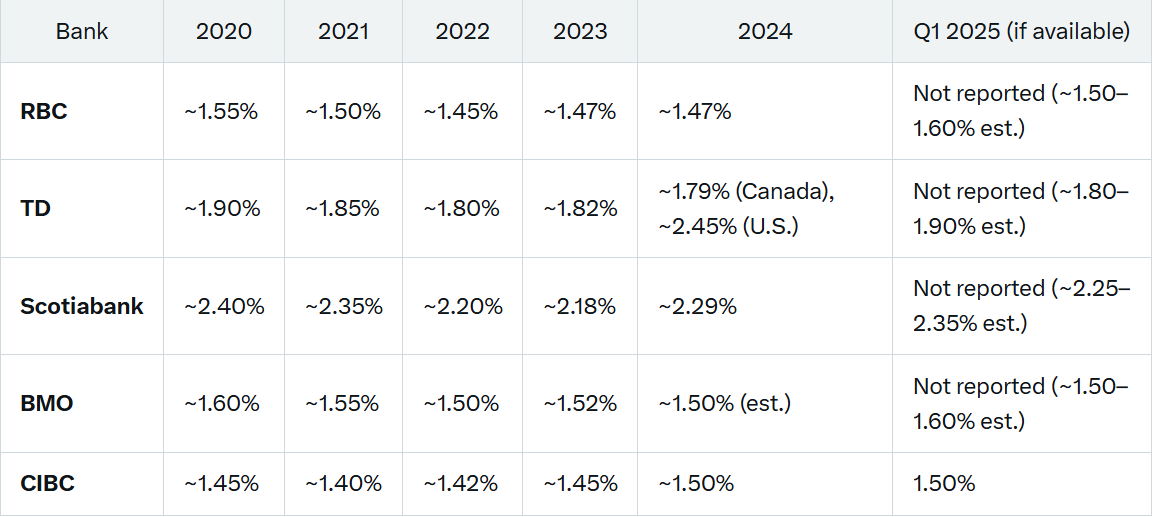
1. Net Interest Margin (NIM)
Definition
NIM measures the difference between interest income earned on assets (e.g., loans, mortgages, securities) and interest expense paid on liabilities (e.g., deposits, borrowings), expressed as a percentage of average earning assets.
Formula

Net Interest Income = Interest revenue – Interest expense.
Average Earning Assets = Typically includes loans, mortgages, and investment securities, averaged over the reporting period (e.g., quarterly or annually).
Relevance
NIM is a core indicator of a bank’s profitability from its lending and investment activities.
It reflects the bank’s ability to manage the spread between what it earns and what it pays.
A higher NIM indicates better profitability, while a declining NIM may signal competitive pressures or rising funding costs.
Influencing Factors
Interest Rates: Set by the Bank of Canada, higher rates typically widen NIM as banks reprice loans faster than deposits.
Loan Mix: Higher-yield assets (e.g., credit card loans) increase NIM, while low-yield assets (e.g., government securities) reduce it.
Funding Costs: Reliance on expensive wholesale funding versus low-cost retail deposits affects NIM.
Competition: Intense competition in Canadian banking can compress margins.
Canadian Context
Canadian banks rely heavily on retail banking (mortgages, personal loans), making NIM sensitive to mortgage rates and deposit pricing.
RBC, BMO, and CIBC show stability, benefiting from domestic focus, while TD and Scotiabank exhibit wider fluctuations due to U.S. and international exposure, respectively.
Banks with international operations may have higher NIMs due to higher-yield markets, but these come with greater risk. Scotiabank’s higher NIM reflects its riskier international portfolio, while TD’s U.S. operations highlight the impact of regional differences in rate environments.

2. Provision for Credit Losses (PCL)
Definition
PCL is the amount a bank sets aside to cover expected losses from loan defaults or other credit impairments.
Formula
Determined based on accounting standards (e.g., IFRS 9), which require banks to estimate:
Expected Credit Losses (ECL): Losses anticipated over the life of loans, considering economic conditions, borrower creditworthiness, and historical data.
PCL can include provisions for performing loans (Stage 1 and 2) and non-performing loans (Stage 3).
Relevance
PCL reflects a bank’s assessment of credit risk and economic outlook.
Higher PCLs indicate expected deterioration in loan quality or economic conditions, reducing net income.
Lower PCLs suggest confidence in loan portfolio quality or improving economic conditions.
Influencing Factors
Economic Conditions: Recessions or high unemployment increase PCLs.
Borrower Risk: Exposure to high-risk sectors (e.g., commercial real estate) raises provisions.
Regulatory Guidance: OSFI may influence provisioning practices during stress events.
Historical Performance: Past loan loss experience informs ECL models.
Canadian Context
Canadian banks are conservative, with robust risk management, but PCLs rose in 2023–2024 due to high interest rates and inflation impacting borrowers’ ability to repay.
High PCLs due to the COVID-19 pandemic forced banks to set aside significant reserves. That has since gone done until most recently as PCLs rose once again, with 2024 reflecting concerns over high interest rates, commercial real estate, and consumer debt.
PCLs are higher in consumer loans (e.g., credit cards, auto loans) than in secured mortgages, which dominate Canadian bank portfolios.
Differences in PCLs highlight varying risk appetites and geographic exposures. TD and Scotiabank face higher risks from international markets, while CIBC and National Bank appear more insulated. BMO’s fluctuations suggest sensitivity to U.S. market conditions.

3. Loan Loss Ratio
Definition
The loan loss ratio measures the provision for credit losses relative to the bank’s loan portfolio, expressed as a percentage.
Formula

Average Net Loans: Total loans minus allowances for credit losses, averaged over the period.
Relevance
Indicates the level of credit risk in the loan portfolio.
A higher ratio suggests greater expected losses, signaling potential asset quality issues.
Used by investors and regulators to assess the health of a bank’s lending activities.
Influencing Factors
Economic Environment: Downturns increase the ratio.
Loan Portfolio Composition: Riskier loans (e.g., unsecured consumer loans) lead to higher ratios.
Credit Underwriting Standards: Tighter standards reduce the ratio.
Canadian Context
Canadian banks maintain low loan loss ratios due to conservative lending practices and a high proportion of secured loans (e.g., mortgages).
Ratios increased slightly in 2024–2025 due to economic pressures like high household debt (Canada’s household debt-to-income ratio was ~180% in 2024).
Lower than U.S. peers due to Canada’s stable housing market and stricter regulatory oversight, but higher than pre-COVID levels.


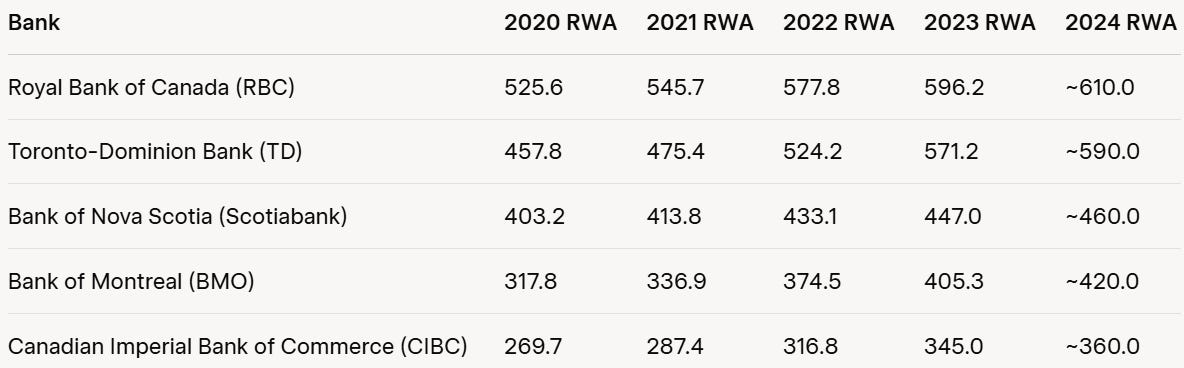
4. Risk-Weighted Assets (RWA)
Definition
Risk-Weighted Assets (RWA) represent a bank's assets or exposures, weighted according to their associated risk levels. Assets are assigned risk weights based on their credit, market, or operational risk, with higher-risk assets requiring more capital.
Formula
RWA = Σ (Asset Value × Risk Weight)
Asset Value: The nominal value of the asset or exposure (e.g., loans, securities).
Risk Weight: A percentage assigned based on the asset's riskiness, as defined by regulatory frameworks like Basel III/IV. For example:
Cash or government bonds: 0% (low risk).
Residential mortgages: 35–50%.
Corporate loans: 20–150%, depending on the borrower's credit rating.
Off-balance-sheet exposures (e.g., derivatives) are converted to credit equivalent amounts before applying risk weights.
Relevance
RWA is critical for determining a bank's capital adequacy under regulatory frameworks like Basel III/IV. It is used to calculate key ratios, such as:
Common Equity Tier 1 (CET1) Ratio: CET1 capital ÷ RWA.
Tier 1 Capital Ratio: Tier 1 capital ÷ RWA.
Total Capital Ratio: Total capital ÷ RWA.
These ratios ensure banks maintain enough capital to absorb losses, promoting financial stability. A higher RWA increases the capital a bank must hold, impacting profitability and lending capacity.
Influencing Factors
Asset Type and Quality: Low-risk assets (e.g., government bonds) have lower weights, while high-risk assets (e.g., unsecured loans) have higher weights.
Credit Ratings: Borrowers with higher credit ratings (e.g., AAA) result in lower risk weights for loans or bonds.
Regulatory Framework: Basel III/IV rules, local regulations, or internal models (e.g., Internal Ratings-Based approach) determine risk weights.
Market and Operational Risks: Volatility in market conditions or operational failures (e.g., fraud, system errors) can increase RWA.
Mitigants: Collateral, guarantees, or credit derivatives can reduce risk weights.
Portfolio Diversification: A diversified portfolio may lower overall risk, impacting RWA calculations.
Canadian Context
Canadian banks have expanded their balance sheets through lending, particularly in mortgages and commercial loans, driven by economic recovery post-pandemic.
RBC and TD lead due to their scale, while BMO and CIBC show faster relative growth due to acquisitions and domestic focus, respectively.
The implementation of Basel III reforms, particularly the Fundamental Review of the Trading Book (FRTB) in 2023, increased market risk RWA for banks like CIBC, TD, and Scotiabank by ~8% due to the shift from internal models to standardized approaches
OSFI’s conservative approach, including stress testing and higher risk weights for commercial real estate and investor mortgages, ensures banks maintain robust capital buffers.
OSFI applies specific risk weights for residential mortgages (e.g., 35% for insured mortgages, higher for uninsured or high loan-to-value ratios), reflecting Canada’s housing market focus.
5. Common Equity Tier 1 (CET1) Ratio
Definition
The CET1 ratio measures a bank’s core equity capital (common shares, retained earnings) as a percentage of its risk-weighted assets (RWA).
Formula

CET1 Capital: Includes common equity minus certain deductions (e.g., goodwill, deferred tax assets).
RWA: Assets weighted by risk (e.g., mortgages have lower weights than corporate loans).
Relevance
A key regulatory metric indicating a bank’s ability to absorb losses and meet capital requirements.
Higher ratios reflect financial strength and resilience to economic shocks.
Required by Basel III and OSFI to ensure systemic stability.
Influencing Factors
Profitability: Higher earnings increase retained earnings, boosting CET1.
Asset Growth: Rapid loan growth increases RWA, potentially lowering the ratio.
Capital Management: Share buybacks or dividend increases can reduce CET1 capital.
Regulatory Changes: OSFI may adjust RWA calculations or capital buffers.
Canadian Context
OSFI mandates a minimum CET1 ratio of 11.5% (including a 7% base, 2.5% capital conservation buffer, 1% domestic stability buffer, and 1% surcharge for systemically important banks like the Big Six).
Canadian banks maintain CET1 ratios well above requirements, reflecting their conservative approach.
Ratios remained stable in 2024–2025, supported by strong earnings, though some banks faced pressure from international exposures.
RBC and TD Bank consistently led with the highest ratios reflecting robust capital positions. Scotiabank showed steady improvement over the years. BMO, CIBC, and National Bank maintained more modest ratios.
OSFI conducts regular stress tests to ensure CET1 ratios withstand adverse scenarios (e.g., housing market crashes).


6. Loan-to-Deposit Ratio
Definition
The loan-to-deposit ratio measures total loans outstanding relative to total deposits, expressed as a percentage.
Formula

Total Loans: Includes mortgages, personal loans, and commercial loans.
Total Deposits: Includes retail deposits (e.g., savings, chequing) and wholesale deposits.
Relevance
Indicates liquidity and the extent to which a bank funds loans with deposits versus other sources (e.g., wholesale funding).
A ratio below 100% suggests reliance on stable deposit funding, while a ratio above 100% indicates dependence on external borrowing.
Balances growth (lending) with liquidity (deposit base).
Influencing Factors
Deposit Growth: Strong retail deposit growth lowers the ratio.
Loan Demand: High demand for loans increases the ratio.
Market Conditions: Tight liquidity markets push banks to rely on deposits.
Canadian Context
Canadian banks typically maintain loan-to-deposit ratios of 80–100%, reflecting a balanced funding model.
The ratios from 2020 to 2024 reflect how Canadian banks navigated a challenging period. Early struggles from the pandemic gave way to recovery as interest rates rose and economic conditions improved. By 2024, most banks achieved better efficiency through a combination of higher revenues, cost management, and digital investments mainly due to strong mortgage and commercial loan growth outpacing deposit growth.
Canadian banks benefit from a large retail deposit base, reducing reliance on volatile wholesale funding compared to some global peers.
OSFI monitors liquidity through metrics like the Liquidity Coverage Ratio (LCR), which complements the loan-to-deposit ratio.


7. Liquidity Coverage Ratio (LCR)
Definition
The Liquidity Coverage Ratio (LCR) is a regulatory standard introduced by the Basel III framework to ensure that financial institutions maintain sufficient high-quality liquid assets (HQLA) to meet short-term liquidity needs during a 30-day stress scenario.
Formula

HQLA: Assets that are liquid, marketable, and have low credit and market risk (e.g., cash, central bank reserves, government bonds).
Total Net Cash Outflows: Expected cash outflows (e.g., deposit withdrawals, debt maturities) minus capped cash inflows over a 30-day stress period.
Relevance
Ensures banks can withstand liquidity crises without relying on external funding.
Mandated by Basel III and enforced by national regulators to promote sound liquidity risk management.
A strong LCR signals to investors and counterparties that a bank can manage short-term obligations.
Protects against sudden liquidity disruptions, such as deposit runs or market freezes.
Influencing Factors
Asset Quality: The availability and quality of HQLA (e.g., Level 1 assets like government securities vs. Level 2 assets like corporate bonds).
Funding Structure: Reliance on volatile funding sources (e.g., short-term wholesale funding) increases outflow assumptions.
Market Conditions: Stress scenarios, such as market volatility or credit rating downgrades, affect asset liquidity and outflow rates.
Operational Factors: Internal liquidity management practices and contingency funding plans.
Regulatory Adjustments: Changes in Basel III rules or local regulatory requirements can alter HQLA eligibility or outflow calculations.
Canadian Context
Canadian banks benefit from a robust supply of Level 1 HQLA, such as Government of Canada bonds and Bank of Canada reserves.
OSFI mandates a minimum LCR of 100%, consistent with Basel III. OSFI tailors stress assumptions to reflect Canadian market conditions, including retail deposit behavior and reliance on wholesale funding.
Banks must report LCR monthly and maintain daily compliance, with OSFI conducting regular reviews.
Canada’s stable banking system, concentrated market, and conservative regulatory approach result in generally high LCRs among major banks, often exceeding 100%. However, challenges include limited HQLA diversity and exposure to housing market risks.


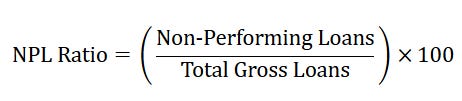
8. Non-Performing Loans (NPL) Ratio
Definition
The NPL ratio measures loans that are overdue by 90 days or more (or otherwise impaired) as a percentage of total loans.
Formula

Non-Performing Loans: Loans where payments are significantly delinquent or unlikely to be repaid in full.
Total Gross Loans: Total loans before allowances for credit losses.
Relevance
A key indicator of asset quality and credit risk.
A higher NPL ratio signals potential losses and weaker underwriting standards.
Used by investors and regulators to assess loan portfolio health.
Influencing Factors
Economic Conditions: Unemployment or recessions increase NPLs.
Loan Type: Unsecured loans (e.g., credit cards) have higher NPL rates than secured mortgages.
Collection Practices: Effective recovery processes reduce NPLs.
Canadian Context
Canadian banks maintain low NPL ratios (typically below 1%) due to stringent credit standards and a high proportion of secured loans (e.g., mortgages, which account for ~50% of loan portfolios).
NPL ratios edged up in 2024–2025 due to high interest rates and consumer debt pressures.
Canada’s stable housing market keeps mortgage NPLs low, but commercial real estate exposures (e.g., office properties) have raised concerns.
OSFI requires detailed NPL reporting to ensure early detection of asset quality issues.

● Written with the help of Grok
Consider joining DiviStock Chronicles’ Referral Program for more neat rewards!Please refer to the details of the referral program.