


As we previously discussed the concept of breakouts from downtrends, let’s now shift our focus to the opposite pattern.
Breakouts from Downtrends

A breakout from a long downtrend in stocks is often referred to as a bullish breakout or a reversal breakout. Alternative terms for this pattern include downtrend breakout and resistance breakout.
A breakdown from a long uptrend in stocks is often referred to as a bearish breakdown or a reversal breakdown. Alternative terms for this pattern include uptrend breakdown and support breakdown.
Upward Trend: In a uptrend, prices are generally rising. A rising trendline connects a series of higher lows on the price chart.
Breakdown: When the price moves decisively below this rising trendline, it signals a potential shift in market sentiment from bullish to bearish.
Both of these types of breakdowns signal a potential shift in sentiment from bullish to bearish. In other words, it suggests a reversal of the existing uptrend, potentially leading to a new downtrend.
What to look out for?
Break Below Support: The stock price breaks below a key support level (often a previous low or an ascending trend line) which had previously halted its downward movement.
Increased Volume: Typically accompanied by an increase in trading volume, indicating strong selling pressure.
Confirmation: Often confirmed by a subsequent pullback to retest the breakdown level and then continuing the downward move.
It is important to note that while a bearish breakdown is a negative sign, it doesn't guarantee a sustained downtrend.
In some cases, a breakdown can signal a market top, whether for a short-term or long-term move, suggesting it might be a good time to take profits or close out a position. Other times, it may simply indicate a pullback to more conservative levels, entering a period of consolidation after an extended upward move. However, various other factors can influence this outcome.
Consolidation in stocks refers to a period when the price of an asset moves within a relatively narrow range, lacking a clear trend in either direction. During consolidation, the stock trades between well-defined levels of support and resistance, creating a horizontal or sideways pattern on the price chart.
Illustrations
Stella-Jones (SJ)

Alimentation Couche-Tard (ATD)
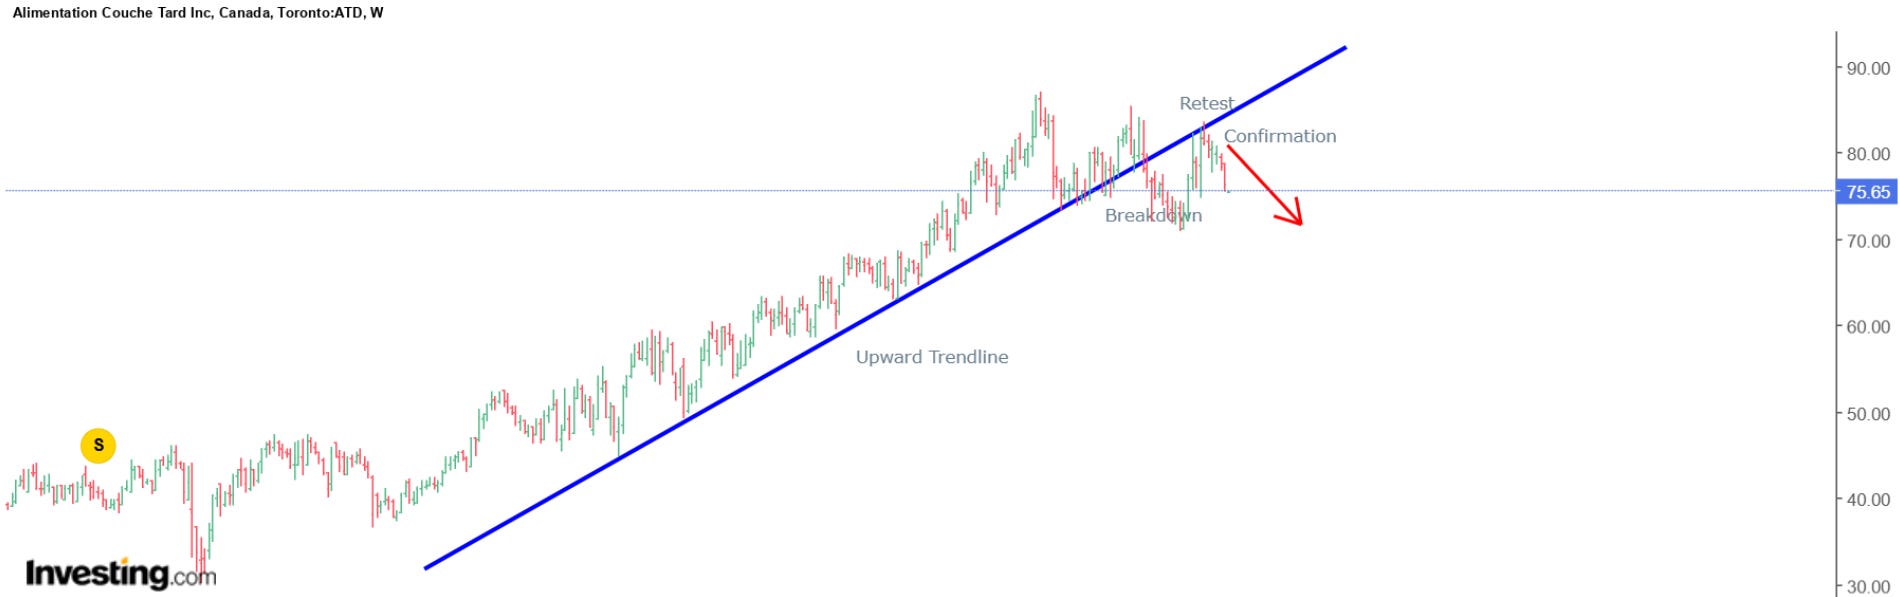
Potential Breakdowns
Microsoft (MSFT)
MSFT has experienced a strong ascent to all-time highs (ATH). Recently, it broke through the support level and then retested it. However, rather than continuing sharply downward, it has entered a phase of consolidation. This represents a unique instance where the stock consolidates before making its next move. Regardless of what follows the retest level, this point marked an opportunity to take some profits after its significant run-up (as I did prior to 2024 closing out), as the stock begins a consolidation period where a new trend will emerge from there.

Brookfield Corp. (BN)
BN has experienced a strong upward run but has recently broken through a significant support trendline. The key question now is when it will retest (considering there is a gap to fill) and then proceed to its next path on the chart. While the company's long-term viability remains intact, the short-term entry is uncertain as it may fall further. Consequently, those who did not invest during the major run-up might be slower to see similar gains in the near future if investing at these levels.

Disclaimer: The information provided is for educational and informational purposes only. It does not constitute financial advice or a recommendation to buy, sell, or hold any specific stocks or securities.

Consider joining DiviStock Chronicles’ Referral Program for more neat rewards!Please refer to the details of the referral program.