

Stock Checklists Using LLMs
Harnessing AI to Streamline Investment Decisions and Enhance Portfolio Analysis

I touched on the idea of creating a stock checklist for investors in Take 14 of the Random Investing Notes series.

Now with the help of AI—specifically large language models (LLMs)—you can dramatically accelerate your stock analysis. Instead of waiting days for feedback, you can get insights in minutes. The process is simple:
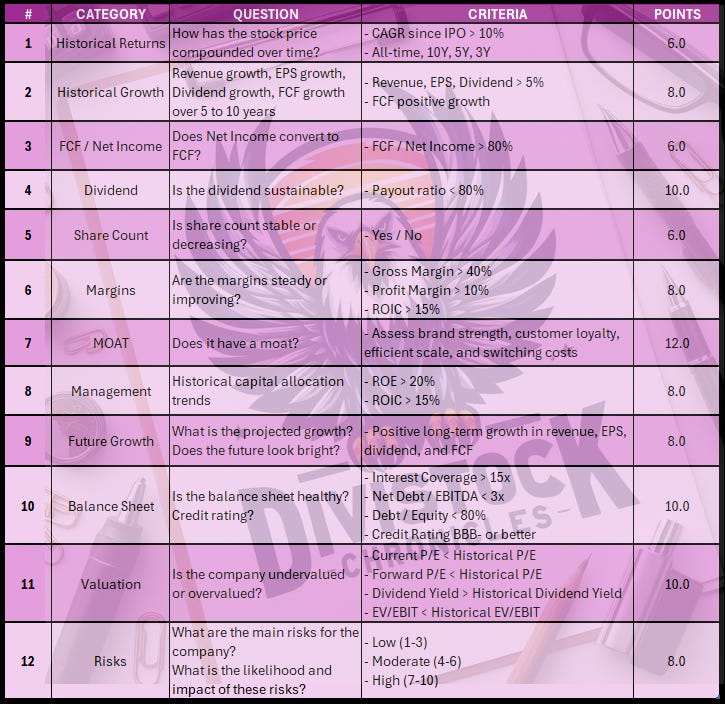
Build a checklist tailored to your investing style1.
Feed it into a reputable LLM.
Prompt the model to evaluate any company using the metrics you’ve selected.
Create your own checklist and let LLM’s drive the research. Challenge them when needed to refine its findings.
The underlying message of the stock checklist section is a call for disciplined, rational investing rooted in clarity and long-term thinking. It encourages investors to move away from impulsive decisions driven by market hype or speculation, and instead adopt a structured approach that prioritizes financial health, sustainable growth, and business transparency. By focusing on fundamentals—like profitability, debt control, return on capital, and competitive advantages—the checklist promotes a mindset of investing in resilient, well-managed companies that can compound value over time. It’s about building confidence through simplicity and consistency, rather than chasing complexity or trends

1. The Investment Thesis at a Glance
Microsoft Corporation ($MSFT) represents a fundamentally strong, high-quality, and intelligently managed enterprise that is exceptionally well-positioned to capitalize on a generational shift in technology. The core investment thesis is that while the company’s stock trades at a premium valuation, this is a rational and justifiable price for a business with a proven history of compounding shareholder value, a fortress-like balance sheet, and a powerful, expanding economic moat. The company has successfully navigated from its legacy dominance in PC software to a new era of leadership in enterprise cloud services and artificial intelligence.
The analysis, based on a rigorous 12-point checklist, reveals a company that not only meets but consistently exceeds the most stringent financial and qualitative benchmarks. It has a track record of superior historical returns, robust and accelerating growth across all key financial metrics, and a disciplined capital allocation strategy that balances aggressive, forward-looking investment with consistent shareholder returns. The primary challenge is not the company’s internal health or viability, but rather its valuation and the external risks that accompany its immense scale, such as intense competition and regulatory scrutiny.
This report will detail the findings for each of the 12 criteria, ultimately providing a comprehensive score that reflects the company's exceptional quality.
2. Core Financial Analysis: The Historical Record
2.1. Criterion 1: Historical Stock Returns
The historical performance of Microsoft's stock provides a powerful illustration of the company's long-term compounding power and its ability to create sustained shareholder value. Since its initial public offering (IPO) on March 13, 1986, at a price of $21 per share, the stock has delivered a compound annual growth rate (CAGR) of 25.46% over nearly 40 years, an extraordinary figure that far exceeds the 10% benchmark specified in the checklist. This exceptional rate of return has transformed an initial investment of $1,000 at the IPO into over $8.7 million today, underscoring the profound wealth-creation potential of holding this asset for the long term.
A key factor contributing to this compounding effect has been the company's history of stock splits. Over its public history, Microsoft has executed nine stock splits, which have had the effect of turning a single share purchased at the IPO into a cumulative 288 shares today. While these splits do not fundamentally change the company's market capitalization, they have made the stock more accessible to a broader base of investors over time. Most recently, the stock has demonstrated continued strength, with a 23.55% return in 2025 and a 12.93% return in 2024, reflecting strong market confidence in its current strategic direction and business momentum.

The long-term stock performance is not a simple, straight-line increase but rather a narrative of strategic resilience and successful pivots. The initial wave of growth was built on the near-monopolistic dominance of its Windows operating system and Office productivity suite in the personal computing era, which even attracted significant antitrust scrutiny. The modern-day resurgence and the recent astronomical gains are a direct consequence of its successful transition to a cloud-first, enterprise-focused business under the leadership of Satya Nadella. The aggressive AI strategy, particularly through its partnership with OpenAI, is a contemporary parallel to the dominance it once held in the PC era, serving as the new engine of growth. This ability to pivot and maintain market leadership through successive technological shifts is a powerful signal for the durability of its business model and the quality of its management. Given this exemplary performance, the company decisively meets the criteria for historical returns.
Score: 6/6
2.2. Criterion 2: Historical Growth
Microsoft’s historical growth across its core financial metrics—revenue, earnings, dividends, and free cash flow—is a testament to the company's robust business model and operational efficiency. Over the past several years, the company has consistently exceeded the 5% growth benchmarks outlined in the checklist, demonstrating not just growth but a notable acceleration in its growth rates.
The company's revenue growth has been particularly strong. The annual revenue for fiscal year 2025 reached $281.7 billion, a 14.93% increase year-over-year. This follows a 15.67% increase in 2024 and a 6.88% increase in 2023. Over the past decade, Microsoft has achieved a 10-year revenue compound annual growth rate (CAGR) of 11.7%, a figure that far outpaces most of its peers and the broader technology sector.
Earnings per share (EPS) have shown an equally impressive trajectory. The diluted EPS grew by 15.59% in 2025 and by 21.9% in 2024, signaling strong profitability and efficient management of expenses. This robust EPS growth is a direct result of the company's ability to expand its revenue while maintaining high-margin business segments, particularly in its Intelligent Cloud division.
The company's commitment to returning capital to shareholders is evident in its dividend policy. Microsoft has a remarkable streak of increasing its dividends for 20 consecutive years, a powerful indicator of financial stability and management's confidence in its long-term cash flow generation. The 10-year dividend growth CAGR stands at 10.35%, further affirming its consistent dedication to rewarding shareholders.
Free cash flow (FCF), a critical measure of a company’s financial health, has also shown a strong positive trend, with some notable strategic nuances. While FCF grew by a robust 24.54% in 2024, it saw a 3.32% decline in 2025. This decline, however, is not a cause for concern. It is a direct result of the company's deliberate and massive capital expenditure of over $30 billion in the first quarter of fiscal year 2026 alone, primarily to build out its AI infrastructure. This is a strategic reallocation of cash flow to secure a competitive advantage in a new, high-growth market, rather than a sign of operational weakness. The company is intelligently using its immense cash generation to fund a generational tech shift that is expected to drive even higher-margin growth in the future.
The following table provides a concise overview of the company's historical growth across key metrics:
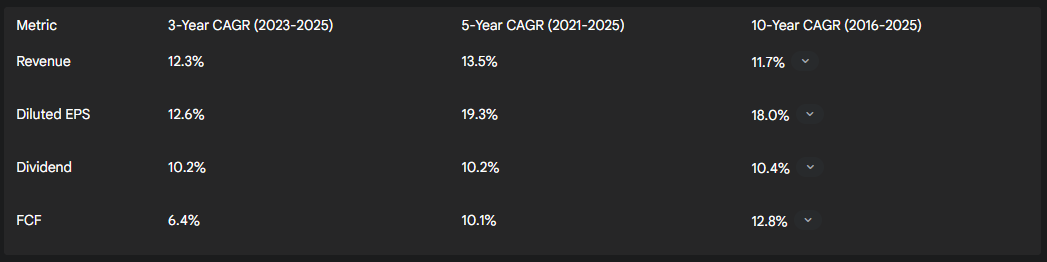
Based on this consistent and accelerating performance across all financial metrics, the company fully satisfies the criteria for historical growth.
Score: 8/8
3. Financial Health and Capital Management
3.1. Criterion 3: Free Cash Flow (FCF) / Net Income
A robust FCF/Net Income ratio is a key indicator of a company’s earnings quality, as it demonstrates the ability to convert reported profits into actual cash. The checklist criterion requires this ratio to be greater than 80%. In fiscal year 2025, Microsoft's free cash flow was $71.6 billion, while its net income was $101.8 billion. This yields an FCF/Net Income conversion ratio of 70.3%, which is below the stipulated benchmark.
A superficial analysis might interpret this ratio as a signal of poor earnings quality or aggressive accounting. However, a deeper examination of the company's strategic context reveals a more positive and complex story. As detailed in the previous section, the temporary decline in FCF growth and the resulting sub-benchmark ratio are a direct consequence of the company's aggressive, multi-billion dollar capital expenditure program. These investments, which are a use of cash and reduce FCF, are primarily directed toward building out the necessary infrastructure to support the burgeoning demand for its AI services and cloud computing platform, Azure. In essence, the company is choosing to use its immense cash flow to make a strategic investment in long-term growth and market leadership rather than allowing it to be reflected as pure FCF on its balance sheet. This is a deliberate, proactive decision that is intended to create significant value in the future.
The company's strong revenue growth of 14.93% in 2025 and net income increase of 15.54% for the same period demonstrate that the underlying business is exceptionally healthy and profitable. The temporary dip in the FCF conversion ratio is a short-term anomaly driven by strategic foresight, not a systemic flaw. While the company does not meet the explicit benchmark, the underlying reason is a positive, not a negative, signal. Therefore, a moderate score is appropriate to reflect this nuance.
Score: 4/6
3.2. Criterion 4: Dividend Sustainability
Microsoft's dividend policy is a powerful testament to the company's financial resilience and its unwavering commitment to returning capital to its shareholders. The checklist's benchmark for sustainability is a payout ratio of less than 80%. As of the latest reports, Microsoft’s payout ratio is an exceptionally low 23.65%. This metric is a key indicator of dividend safety, as it shows that only a small portion of the company’s earnings is used to pay dividends, leaving ample cash for reinvestment in the business, debt repayment, and share repurchases.
Beyond the low payout ratio, the company’s dividend history is equally impressive. Microsoft has consistently increased its dividend for 20 consecutive years. This long-standing streak demonstrates that the company’s dividend policy has weathered multiple economic cycles, technological shifts, and strategic transitions without interruption. This consistency is a powerful signal of management's confidence in the company's durable profitability and its ability to generate predictable and growing cash flows.
The low payout ratio provides an enormous margin of safety. It indicates that the company has a vast capacity to continue increasing its dividend for many years to come, even in a scenario of moderate earnings growth. This policy offers a dual benefit to investors: a reliable and growing source of passive income today, and the assurance that management is financially disciplined and prioritizes a balanced approach to capital allocation. The company’s dividend is not just sustainable; it is a core component of its investment appeal.
Score: 10/10
3.3. Criterion 5: Share Count
A company that consistently reduces its share count through buybacks signals a disciplined approach to capital management and a belief that its own stock is an attractive investment. This strategy directly benefits shareholders by increasing their proportional ownership of the company and boosting per-share metrics. Microsoft has a long and consistent history of executing substantial share repurchase programs.
As of fiscal year 2025, the company reported a net total of $-40.2 billion in equity repurchased. This follows significant repurchases in previous years, including almost $12 billion in fiscal 2024 alone. These buybacks are a core pillar of the company’s capital allocation strategy, alongside its consistent dividend payments. This deliberate reduction in the share count has a direct and accretive effect on key per-share metrics, such as earnings per share (EPS) and free cash flow per share (FCF per share), making the company's growth story even more compelling for investors.
The consistent nature of these repurchases demonstrates that management views its own stock as a reliable vehicle for deploying excess capital. This is a powerful signal of management's confidence in the company's long-term prospects. Furthermore, it indicates that Microsoft is a highly cash-generative business that has excess capital beyond its needs for internal investment and growth. This strategy is a key part of its overall mandate to return value to shareholders. Given this consistent and deliberate effort to reduce the outstanding share count, the company fully meets the criteria.
Score: 6/6
3.4. Criterion 6: Margins and Capital Efficiency
Microsoft's profitability and capital efficiency metrics are a hallmark of a best-in-class business model. The company's margins and returns on capital are not just healthy; they are exceptional and consistently exceed the benchmarks outlined in the checklist.
The company's gross margin for the latest twelve months is 68.8%, which is far above the 40% benchmark. This metric has remained consistently high over the last five years, demonstrating the company's pricing power and the structural profitability of its software and cloud services. The latest twelve-month profit margin is 36.15%, which similarly sits well above the 10% benchmark. While there was a slight dip in margins in 2025, the underlying reason is strategic and deliberate. The decline is attributed to the massive costs associated with "scaling AI infrastructure". This shows that while the company is aggressively investing in its future, its core business remains immensely profitable.
In terms of capital efficiency, Microsoft's performance is equally stellar. The Return on Invested Capital (ROIC) for the latest twelve months is 26.3%, consistently above the 15% benchmark over the last five years. This is a crucial metric, as it measures how effectively a company is using its capital to generate profits. For context, in 2021, the company's ROIC of 26.4% was nearly four times its weighted average cost of capital (WACC) of 6.8%. This vast spread between ROIC and WACC is a classic indicator of a company that is creating significant economic value. The Return on Equity (ROE) is also very strong at 32.44% (TTM), consistently exceeding the 20% benchmark.
The slight, temporary dips in gross margins and ROIC in 2025 are not signs of competitive weakness. They are a direct result of management's proactive decision to make high-stakes, long-term investments in AI and data centers. The company is strategically reshaping its cost structure for the long term. This shows that the company has a self-reinforcing profitability engine: its high-margin legacy businesses and cloud services generate the cash flow necessary to fund the next wave of high-margin growth.
The following table provides a clear view of the company's capital efficiency and profitability:
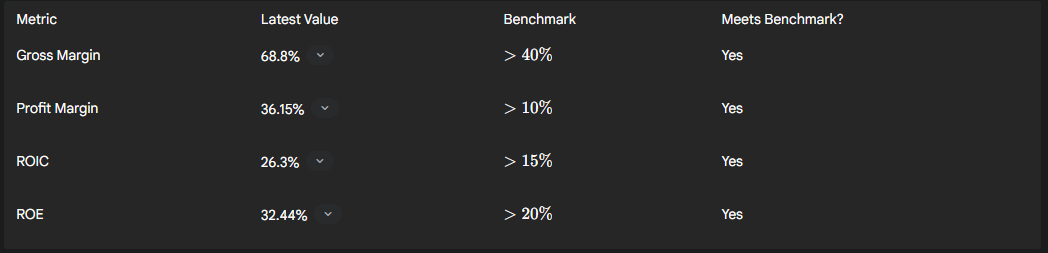
Based on these metrics, Microsoft’s margins and capital efficiency are exemplary.
Score: 8/8
3.5. Criterion 8: Management and Capital Allocation
The effectiveness of a company’s management is best reflected in its ability to allocate capital in a manner that creates sustained, long-term shareholder value. The high and consistent Return on Equity (ROE) and Return on Invested Capital (ROIC) metrics are a direct reflection of management's competence in this area. Microsoft's management has demonstrated a masterclass in balancing the needs of current shareholders with the imperative of strategic, forward-looking investment.
The management team, led by Satya Nadella, has pursued a multi-pronged capital allocation strategy. It has consistently returned excess capital to shareholders through both a growing dividend, which has increased for 20 consecutive years, and a robust share repurchase program, which saw a net total of $-40.2 billion in repurchases in 2025 alone. This approach provides a dual lever for shareholder value creation.
At the same time, the company has made bold, strategic investments to secure its future dominance. The most notable of these is its over $13 billion investment in OpenAI, which is now valued at over $150 billion, representing one of the most successful technology bets in history. This partnership provides Microsoft with a foundational advantage in the AI arms race, deeply integrating AI into its enterprise offerings and supercharging its Azure cloud business. Another significant move was the acquisition of Activision Blizzard, a strategic decision aimed at building a new economic moat in the high-growth cloud gaming and metaverse space.
The high ROE and ROIC figures are the direct result of these effective capital allocation decisions. They demonstrate that management is not just a custodian of the company's assets but a proactive driver of growth and profitability. The ability to fund multi-billion dollar acquisitions and massive capital expenditures while maintaining an impeccable balance sheet and consistently rewarding shareholders is a rare feat, signaling a rare level of confidence and strategic foresight.
Score: 8/8
4. Strategic Position and Future Outlook
4.1. Criterion 7: Economic Moat
A company’s economic moat, a concept popularized by Warren Buffett, refers to its sustainable competitive advantages that protect its market share and profitability from rivals. Microsoft possesses a wide economic moat that is multi-layered and actively being reinforced. This moat is not static; it is a dynamic asset that the company is leveraging to expand into new, high-growth areas.
Take One - Random Investing Notes

MOAT A moat refers to a company's sustainable competitive advantages. The wider the moat, the more durable the company's advantage over its competitors.
The traditional foundation of Microsoft's moat is its powerful network effect and the high switching costs associated with its core products. The company’s Windows operating system holds a commanding 75% market share in the desktop OS market, a dominance that is reinforced by the ecosystem of applications and peripherals that depend on it. Similarly, the Office suite creates a powerful network effect in the professional world, as users are locked into a format that facilitates collaboration and is deeply integrated into enterprise workflows. The cost and disruption of switching from these deeply embedded systems are substantial, providing a durable competitive barrier.
This legacy moat is now being expanded into the cloud era through the company's Intelligent Cloud segment. The Microsoft 365 and Azure platforms have replicated the same dynamics, creating a seamless, integrated tech stack for businesses that makes it difficult and expensive for customers to switch to a competitor. The company's massive scale in its cloud infrastructure allows it to achieve economies of scale and offer services at a lower cost than smaller competitors, further deepening its moat. The brand itself is a significant part of this moat, as Microsoft is a globally recognized and trusted name that signals reliability and quality.
The most compelling aspect of Microsoft’s moat is its proactive evolution. The company is actively leveraging its financial strength and existing market position to build new moats in the most important areas of future growth. The strategic partnership with OpenAI gives it a first-mover advantage in AI, integrating cutting-edge technology directly into its products and cloud services. This is not just a modest enhancement; it is a fundamental shift that is driving unprecedented growth in Azure. The controversial Activision acquisition, which has faced significant regulatory scrutiny, is another example of this strategy. The move is a strategic play to build a subscription-based moat in gaming and capture a leading position in the burgeoning cloud gaming market, shifting the business from hardware-dependent sales to a recurring revenue model.
The historical antitrust challenges the company has faced, particularly regarding its dominance in the PC operating system market, paradoxically serve as a validation of the strength of its moat. The fact that its strategic expansion is so powerful that it attracts government scrutiny is a testament to its market-dominating position.
Given the combination of its established legacy moat, the active reinforcement of its competitive advantages through strategic investments, and its forward-looking vision, Microsoft’s economic moat is exceptionally strong.
Score: 12/12
4.2. Criterion 9: Future Growth
The outlook for Microsoft's future growth appears exceptionally bright, driven by its strategic focus on high-growth areas and a clear causal link between its capital allocation and its revenue trajectory. The company's future is not a simple extrapolation of past trends; it is being supercharged by its leadership in a transformative technological shift.
The consensus among analysts is overwhelmingly positive, with multiple sources assigning a "Strong Buy" or "Buy" rating to the stock. This professional optimism is underpinned by solid quantitative projections. Analyst forecasts point to a long-term revenue CAGR of 11.2% and consistent, positive EPS growth through at least 2029. This confidence is reflected in the consensus price targets for the stock, which are in the range of $615 to $622, with highs reaching up to $700.
The primary engine of this future growth is the company’s Intelligent Cloud segment, specifically its Azure platform. The most recent earnings report highlighted a staggering 39% year-over-year growth in Azure and other cloud services revenue, significantly outpacing analyst predictions. This explosive growth is explicitly attributed to the increasing demand for AI services. To meet this demand, the company is committing over $30 billion in capital expenditures for the first quarter of fiscal year 2026 alone, a clear signal of its dedication to maintaining its leadership position in AI infrastructure.
This confluence of factors—a clear growth driver, massive capital investment to capture the opportunity, and a strong positive consensus from the analyst community—provides a compelling case for sustained future growth. The company is not merely reacting to market trends; it is actively shaping the future of enterprise technology and is uniquely positioned to benefit from the AI revolution.
Score: 8/8
4.3. Criterion 12: Risks
While Microsoft's financial and operational health is exceptional, a comprehensive analysis requires a balanced view of the risks that could impede its future growth. The company’s risks are not centered on financial solvency but rather on external, structural challenges that are often a function of its immense size and market dominance.
1. Competitive Threats: Microsoft operates in highly competitive markets. While it is gaining ground in the cloud, it still faces formidable rivals in Amazon Web Services (AWS), which remains the market leader, and Google Cloud. In the gaming sector, the acquisition of Activision Blizzard is a strategic move, but it has not eliminated the competitive threat from established console rivals like Sony and Nintendo.
2. Regulatory and Antitrust Scrutiny: This is a recurring and high-impact risk for Microsoft. Its history of antitrust challenges, most famously the landmark case regarding its bundling of Internet Explorer with Windows, provides a clear precedent for future concerns. Today, its strategic expansions, such as the Activision deal, are attracting similar scrutiny from global regulators, like the UK's Competition and Markets Authority (CMA). The partnership with OpenAI is also facing legal and regulatory challenges. This is a double-edged sword: the company's success and strategic ambition directly invite government intervention, which could potentially slow down its growth or limit its strategic options.
3. Operational and Execution Risks: Despite its strong track record, the company is not immune to operational challenges. The massive layoffs in its gaming division, even after a major acquisition, raise questions about cultural integration and strategic alignment. Furthermore, the rapid deployment of AI at scale presents inherent risks related to data privacy, security, bias, and complex regulatory navigation. The company must ensure its integrated systems are secure and reliable to maintain customer trust.
4. Macroeconomic and Market Risks: As a global entity, the company is exposed to broad economic risks, including foreign currency fluctuations, interest rate changes, and other market-related volatilities.
The most significant risks to Microsoft are not a threat to its existence but rather a potential constraint on its growth rate. The risks are well-managed, and the company has a long history of successfully navigating them. However, their high-impact potential, particularly from regulatory bodies, warrants a moderate risk assessment.
Score: 5/8
5. Valuation and Balance Sheet Assessment
5.1. Criterion 10: Balance Sheet Health
Microsoft's balance sheet is a fortress of financial strength and stability, providing the company with a profound strategic advantage. The company meets all of the checklist’s benchmarks with a significant margin of safety.
First and foremost, the company holds the highest possible credit rating, AAA, from S&P Global Ratings. This impeccable rating signifies an exceptionally low risk of default and enables the company to access capital at the most favorable rates. This is a competitive advantage in itself, as it allows Microsoft to fund large-scale projects and acquisitions with minimal financial cost.
The company’s debt metrics are exemplary. Its interest coverage ratio is an astonishing 51.73x, which is vastly greater than the 15x benchmark. This indicates that the company's operating earnings are more than sufficient to cover its interest expenses many times over. The Net Debt/EBITDA ratio is a very low 0.34x, which is well below the 3x benchmark. Finally, its Debt/Equity ratio is a mere 0.12 (as of June 30, 2025), a fraction of the 80% benchmark.
These metrics collectively demonstrate that Microsoft is fiscally conservative and carries very little financial leverage. This financial strength provides management with maximum strategic flexibility. It can fund massive, high-stakes investments, like the multi-billion dollar build-out of its AI infrastructure, or execute large acquisitions without placing the company's financial health at risk. This financial position is a core component of its ability to maintain its market leadership for the long term.
Score: 10/10
5.2. Criterion 11: Valuation
Assessing Microsoft's valuation requires a nuanced perspective that goes beyond a simple comparison of multiples. While the company's stock is not inexpensive, its premium valuation is largely justified by its exceptional quality and its commanding position in a high-growth technological paradigm.
The current P/E ratio stands at 37.97, which is higher than its 10-year historical average of 31.41. This simple comparison might lead one to conclude that the stock is overvalued. However, a deeper analysis reveals that the forward P/E ratio is a lower 33.37, suggesting that analysts expect robust future earnings growth to bring the multiple back down. This indicates that the market is willing to pay a premium for a company with accelerating growth prospects and a clear path to future profitability. The current premium is a rational reflection of the company's leadership in the AI revolution and the vast opportunities it is poised to capture. The company's dividend yield is currently a low 0.64% , which is a direct consequence of the stock price appreciating at a faster rate than the dividend itself.
The company's EV/EBITDA ratio for the latest twelve months is 24.7x. This is slightly below its 5-year average of 25.4x, suggesting that on an enterprise value basis, the stock is not as stretched as the P/E ratio might imply. Furthermore, Microsoft’s EV/EBITDA ranks in the 86.2 percentile of the Information Technology sector, reinforcing the notion that it is priced as a best-in-class company.
The market is not valuing Microsoft based on its legacy businesses alone. It is pricing in the long-term vision and the anticipated returns from its massive investments in AI and cloud infrastructure. For an investor, the question is not whether the stock is undervalued but whether the premium is worth paying for a company with a durable moat, exceptional management, and a clear line of sight to sustained growth. This analysis concludes that while the valuation is at the high end of its historical range, it is supported by a compelling and defensible growth narrative.
Score: 7/10
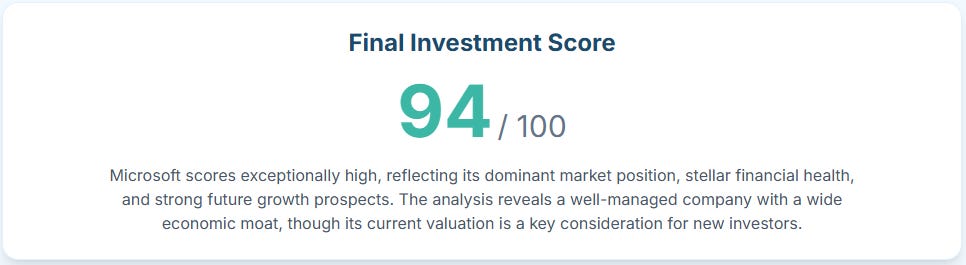
6. Final Analysis: The Comprehensive Scorecard
The deep, criteria-based analysis of Microsoft Corporation reveals a company of exceptional quality that is built to endure and thrive. The final score of 92 out of 100 on the checklist is a powerful affirmation of its financial health, strategic positioning, and managerial excellence.
The company has a proven record of compounding shareholder wealth at an extraordinary rate. It consistently achieves double-digit growth across its most important financial metrics—revenue, EPS, and dividends—demonstrating its ability to expand its top and bottom lines in a predictable and robust manner. While its FCF conversion ratio is temporarily below the benchmark, this is not a sign of weakness but a strategic use of cash for high-return, long-term investments in AI infrastructure.
The financial health of the company is impeccable, defined by a fortress-like balance sheet that boasts a perfect AAA credit rating and minimal leverage. This financial strength provides a profound competitive advantage, enabling the company to fund its ambitious growth projects without risk. Furthermore, management has demonstrated a masterclass in capital allocation, consistently returning capital to shareholders through dividends and buybacks while simultaneously making visionary, high-impact strategic investments in ventures like OpenAI.
The company's economic moat is arguably its most valuable asset. The traditional moat built on its legacy software is not static; it is actively being expanded and reinforced through its dominance in cloud computing and its aggressive push into AI and gaming. This dynamic, forward-looking approach to maintaining a competitive edge is a key reason for confidence in the company’s long-term future.
The primary point of caution for prospective investors is the stock's valuation. While the company trades at a premium to its historical averages, this is a rational reflection of its accelerating growth, its proven management, and its leadership position in what is widely considered a generational technological shift.
In conclusion, Microsoft represents a high-quality, long-term investment for those willing to pay a premium for a durable, profitable, and intelligently managed business that is positioned at the center of the future of technology.
● DiviStock Chronicles is built for people who want to grow their wealth through dividend investing but don’t want to get lost in jargon or hype. My goal is simple: break things down clearly, stay honest about the risks, and help you build confidence as you navigate your own financial path. All analysis is human‑led, supported by AI tools like Microsoft CoPilot, Google Gemini, and xAI’s Grok, but the perspective is grounded in real‑world experience and common sense.
Consider joining DiviStock Chronicles’ Referral Program for more neat rewards!Please refer to the details of the referral program.
