While my investing focus is often on fundamentals, there's a wealth of insight to be gained from simple stock chart patterns. In this monthly series of blog posts, I'll break down some straightforward yet perceptive chart patterns that can be identified in a select group of individual stocks. These patterns have been previously taught in earlier blog posts, which you can find at the end of this article. As always, exercise your own discretion and judgment when making financial decisions, as this is not investment advice.
With all the market fluctuations—or rather, the sea of red—after-hours, I took a closer look at the charts and decided to provide a bonus update alongside my usual month-end chart wrap-ups.
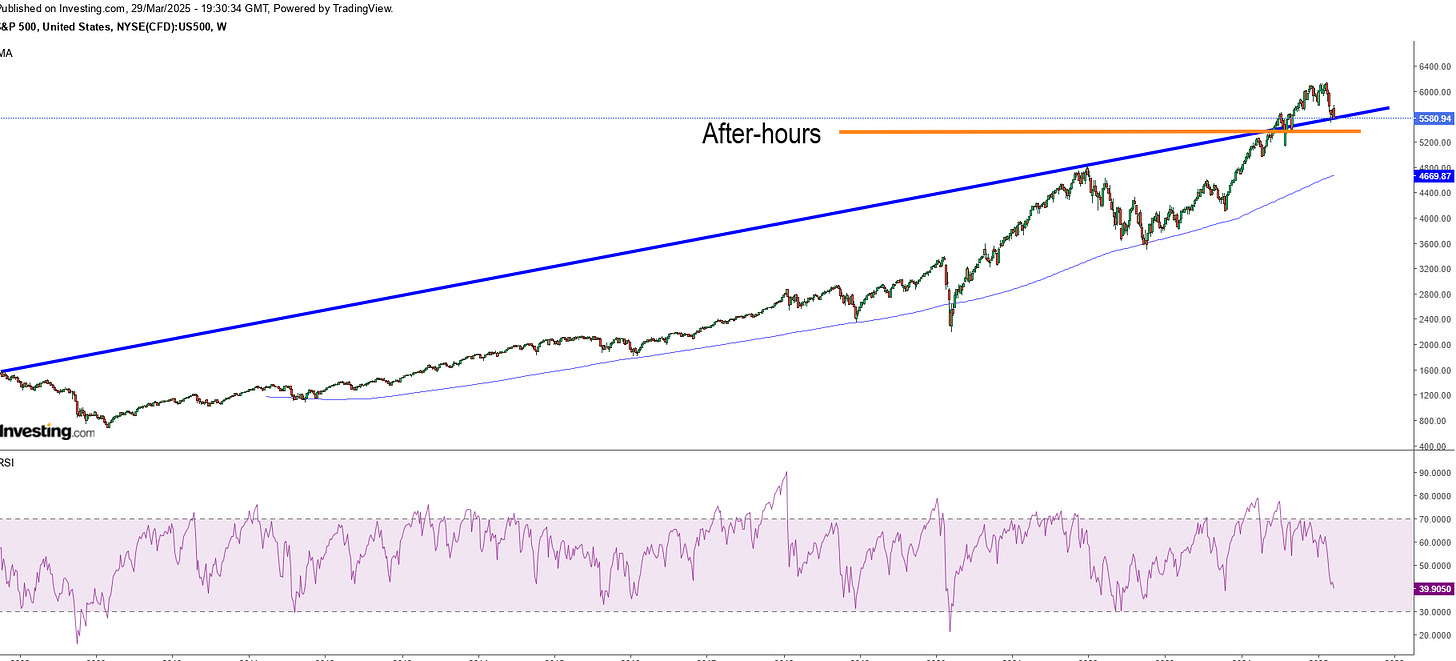
S&P 500
March recap: This usually is not a good momentum sign, so April could be a bit shaky, especially considering ‘Liberation Day’ on April 2nd as Trump has framed it (…) While a breakdown to new lows is possible, it does not necessarily signal the start of a bear market. This could turn out to be a false move. Upon retesting the blue line, we can assess whether it breaks back above, potentially leading to a rally into the summer, or if it fails, thereby confirming the onset of a bear market.
There’s the break, confirmation should happen tomorrow (Thursday). There’s probably even more downside expected so be prepared. The key will be on the retest as mentioned in my previous segment. Consider this situation from a different perspective—if tariffs were the catalyst for this economic turmoil, then logically, when countries come together to negotiate and finalize trade agreements, the opposite effect should take place. Of course, there are numerous other factors shaping the broader macroeconomic landscape, but for the sake of discussion, the focus here remains solely on tariffs.
Amazon (AMZN)
Since December 2022, this parallel channel has remained intact, with the after-hours movement merely pulling the stock back to its lower boundary. Looking at past divergences, the pink line had signaled a bearish divergence—and the result? A sharp decline. Now, the stock is showing subtle signs of a hidden bullish divergence. If the anticipated drop tomorrow keeps it hovering around the $180s, this divergence could strengthen even further. The real question is: as new developments unfold and institutional traders position themselves, will this parallel channel finally break? This could be an opportunity, but you need to await further moves.
Dollarama (DOL)
Beyond the tariff news, DOL is set to report Thursday morning, and its chart is quite the spectacle. The stock had been moving within an ascending parallel (purple) for a while before shifting into a descending parallel (yellow). Recently, it broke out ahead of earnings, touching back to the base of the ascending parallel. Given these developments, what’s the next move?
Considering DOL sources a significant portion of its products from China—being a dollar store chain—the heavy tariff burden on China could lead to a sharp pullback tomorrow. Just look at Apple (AAPL) after-hours. A retest back to the top of the descending parallel around the $130s seems plausible. However, the upcoming earnings call may help ease some of the tension. The chart is also showing a cup and handle pattern, which could mean DOL could explode to the upside.
USD/JPY
The unwinding of the JPY carry trade began in August 2024, following the Bank of Japan’s rate hike from 0.1% to 0.25%. This triggered a sharp yen appreciation, prompting a global sell-off as investors rushed to close their carry trade positions.
Now, a second wave of this unwind could be unfolding, already exerting pressure on the market. Take a look at the black line—compare the current levels to those in 2024. These macro forces, though overshadowed by the tariff news, remain critical factors to consider.
March Charts Wrap-up
While my investing focus is often on fundamentals, there's a wealth of insight to be gained from simple stock chart patterns. In this monthly series of blog posts, I'll break down some straightforward yet perceptive chart patterns that can be identified in a select group of individual stocks. These patterns have been previously taught in earlier blog po…
Disclaimer
The content provided on this page by the publisher is not guaranteed to be accurate or comprehensive. All opinions and statements expressed herein are solely those of the author. Trading stocks can incur losses of the invested capital. Even all capital can be lost. This page represents my personal strategies, views, and decisions, which may not be appropriate for other investors. Please use common sense or consult with an investment professional before investing your money.
Consider joining DiviStock Chronicles’ Referral Program for more neat rewards!Please refer to the details of the referral program.


