March Charts Wrap-up
Insights and Patterns: A Monthly Dive into Stock Chart Analysis for the Average Investor
While my investing focus is often on fundamentals, there's a wealth of insight to be gained from simple stock chart patterns. In this monthly series of blog posts, I'll break down some straightforward yet perceptive chart patterns that can be identified in a select group of individual stocks. These patterns have been previously taught in earlier blog posts, which you can find at the end of this article. As always, exercise your own discretion and judgment when making financial decisions, as this is not investment advice.
S&P 500
February recap: Bearish divergence on the RSI since early 2024. A healthy correction to the $5,200–$5,700. Current outlook doesn’t support further upward momentum.
Let’s start with the world’s most popular index, the S&P 500 (SPX). A small correction ensued as expected and the Fear and Greed Index continues to sit at the lower end of fear, reflecting cautious sentiment.
On a 200-day moving average, it broke down and retested this past week, only to fail back to the downside. This usually is not a good momentum sign, so April could be a bit shaky, especially considering ‘Liberation Day’ on April 2nd as Trump has framed it. One major trend line I have noticed is from the highs of 2007 right before the GFC, which was touched again at the end of 2021, and broke through in 2024. It has now retraced exactly back to that line - fascinating.
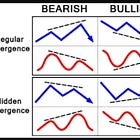
The recent bearish RSI divergence on the SPX has materialized. Following this slight reset, we could face a challenging period for a few more weeks. The blue line stands out as a key point of interest. While a breakdown to new lows is possible, it does not necessarily signal the start of a bear market. This could turn out to be a false move. Upon retesting the blue line, we can assess whether it breaks back above, potentially leading to a rally into the summer, or if it fails, thereby confirming the onset of a bear market.
From a news perspective, April is likely to focus heavily on tariffs. The way Trump operates in by taking a very hardline approach initially, presenting a worst-case scenario, and then gradually backtracking to achieve his goals, even if only partially. This dynamic could unfold throughout the month, with tariffs continuing to exert downward pressure on sentiment. Ultimately, Trump may relent, as he tends to dislike prolonged stock market declines. A significant event in April is the Canadian election on April 28, 2025, which could mark the point where tariff discussions subside, and firm negotiations are finalized. This development might set the stage for a summer rally—but that's just my take.
Set aside the broader market concerns for now—we still have some time before they become pressing. Keep in mind that the Federal Reserve has the ability to stimulate a last rally if conditions worsen. Additionally, deregulation and tax cuts are still on the horizon. Just my opinion, of course.
Gold (GLD)
February recap: GLD continues to trade within its established parallel channel.
GLD has been on a strong streak this year, and such performance often signals a warning that the economy may be approaching a critical point. It remains within this parallel channel formation, defying expectations of a small pullback as it steadily climbs to new all-time highs (ATHs). While a pullback might seem inevitable, there are compelling reasons to believe GLD could reach even greater ATHs.
When the bear market eventually begins, GLD won’t be immune. However, as a safe haven, it is likely to experience less severe declines and is often among the first to recover. This year, I’ve started allocating a small portion of my portfolio to gold in light of these trends.
Bitcoin (BTC)
February recap: In the short term, I anticipate a retracement, or retesting, to the bottom of the parallel channel, around the $90K–$91K range (…) The next common support zone appears to be in the $70K–$75K range in that case.
BTC retested the $90K-$91K range as anticipated and then confirmed its downtrend from there. Since its double-top pattern, it has been in a sharp downtrend, marked by higher lows and lower lows. However, there appears to be significant support around the $70K level.
While the unfolding of this scenario remains uncertain, those considering allocating a portion of their portfolio to cryptocurrency—specifically BTC—might view this potential development as an opportunity to enter the market. That said, the volatility remains elevated, and BTC is far from being a safe haven like gold.
Schwab US Dividend Equity ETF (SCHD)
The ascending parallel channel has remained intact since October 2023. While it has been trending in the lower half of the channel for some time—a pattern that doesn't always indicate strength—there has been an uptick in volume, which could be a positive signal. Additionally, SCHD recently underwent its annual reconstitution, a factor worth considering.
Alimentation Couche-Tard (ATD)
If the sentiment was not so dire, this would be a great time to initiate a position in ATD. Although it broke down from an upward channel, it is now at a critical point.
It has formed a downward parallel channel, hitting the top and bottom several times.
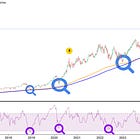
It has now bottomed against the uptrend (blue) line that started at the lows of the pandemic.
It is basically at the 200-week moving average.
The chart below illustrates ATD’s dividend yield over the past five years in comparison to its stock price. Historically, a significant rise in the yield relative to the stock price has indicated a buying opportunity. While macroeconomic factors must be considered, this presents an intriguing perspective.
Brookfield Corp. (BN)
February recap: That said, if the (RSI) trendline breaks down and is confirmed, a significant pullback is likely to follow.
I find BN's current patterns fascinating. As previously noted, the RSI line was in perfect ascension until it broke, as anticipated back in March. Consequently, BN's price followed the overall market's downturn. However, what's noteworthy is that its upward trendline, established since November 2023, remains intact. Take a look at where it bounced—right at the intersection (orange circle) of the upward trendline and the bottom of the downsloping parallel channel. On the daily chart, it aligns almost perfectly with the 200-day moving average.
It's worth mentioning that, as a private equity firm, BN is likely to face significant challenges during a recession. That said, if one final rally occurs, my price target would be $90. Beyond that, we’re all familiar with what often unfolds in an ascending wedge pattern—a break to the downside.
Telus (T)
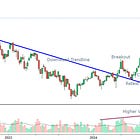
This one has plenty to analyze. Starting with the major downtrend (blue line), it was broken, retested, and confirmed—a significant development for Telus considering its poor performance since reaching its all-time high. The uptick in volume suggests that investors may have shifted to a more defensive stance, as Telus offers an attractive dividend and remains a reliable player in Canada's telecommunications landscape.
Furthermore, the descending parallel channel has now been invalidated, giving way to the formation of a new ascending parallel channel. Telus is showing promising progress, with higher highs and higher lows—patterns that tend to resonate well with investors. If I didn’t already hold a substantial position, this level would definitely catch my attention as a solid safety play.
Microsoft (MSFT)
February recap: The stock is currently in a downward trend, yet it has shown strong support around $385, a level that has withstood multiple tests. If this support were to break, ~$350 could be the next target, which coincides with the 200-week moving average.
MSFT continues in a challenging position. The stock is currently in a downward trend, and the previous support level around $380 appears to be breaking. If this support were to confirm a break, ~$350 could be the next target, which coincides with the 200-week moving average. Historically, this moving average has proven to be a dependable signal for identifying excellent buying opportunities in high-quality companies. Taking a broader perspective on the RSI trend might indicate potential for investing in one of the top-performing compounders of the past decade. Notably, when the RSI reaches a specific lower threshold, it has consistently highlighted favorable buying opportunities.
Canadian Natural Resources (CNQ)
February recap: If it manages to reverse its current downtrend, there is potential upside targeting the $60s. This is the essence of a risk-reward play.
This remains a classic example of a risk-reward scenario. Tariff threats drove the price down to $37, but it quickly rebounded, avoiding a breakdown from the ascending parallel channel—a crucial moment. Despite this, it continues to form higher lows and lower lows. Now, we have a promising chance to observe its next move. If it revisits the bottom of the parallel channel without breaking to the downside or confirming a bearish move, there’s potential for an upward climb to the $60s, reaching the top of the parallel.
Disclaimer
The content provided on this page by the publisher is not guaranteed to be accurate or comprehensive. All opinions and statements expressed herein are solely those of the author. Trading stocks can incur losses of the invested capital. Even all capital can be lost. This page represents my personal strategies, views, and decisions, which may not be appropriate for other investors. Please use common sense or consult with an investment professional before investing your money.
Consider joining DiviStock Chronicles’ Referral Program for more neat rewards!Please refer to the details of the referral program.


