


Valuation Methods
There are a wide variety of valuation techniques to use when valuing companies. This article will focus on one of my preferred methods - the Levered Free Cash Flow model.

When it comes to valuing stocks, investors have a plethora of methods at their disposal. From the discounted cash flow model in its number of variations to the dividend discount model, each method has its own strengths and weaknesses, and there’s no one-size-fits-all approach.
In this article, I will dive into the valuation technique that I have started using to value stocks - the Levered Free Cash Flow (LFCF) discounted cash flow model.
Hope the understanding of this method will benefit you in your decision to pick individual stocks and assess their intrinsic value.
Intrinsic Value - a measure of the underlying worth of an asset.
What constitutes intrinsic value to one individual may differ for another; it is not an infallible concept. Nevertheless, valuation methods exist to generate the most accurate projections with the best available information at one point in time. The quality and reasonableness of the inputs are crucial because, as the adage goes, "garbage in, garbage out."
Let’s dive in!
Levered Free Cash Flow Model
Also known as the Free Cash Flow to Equity (FCFE) model, the LFCF discounted cash flow model is one way to estimate the intrinsic value of a company’s stock. It is a measure of the cash available to equity holders after accounting for all expenses, reinvestments, and debt-related payments.
The formula for calculating LFCF is:
LFCF = Net Income + Depreciation and Amortization - Change in Net Working Capital - Capital Expenditures + Net Borrowing
Where:
Net Income: The accounting profit of the company, inclusive of all operating costs, including interest expense.
Depreciation and Amortization: The non-cash expenses that reduce the value of assets over time.
Change in Net Working Capital: The difference between the current and previous period's net working capital.
Capital Expenditures: The amount of money spent on long-term assets such as property, plant, and equipment. This includes additions to intangibles as well for technology companies.
Net Borrowing: The difference between the current and previous period's debt. If leverage is fairly stable, debt-to-capital ratio is used.
Each area will have its own set of projections. These may be derived from analysts' projected estimates or from historical averages, using a common denominator like revenues or net income.
From this point on, the discounted cash flow (DCF) portion comes into play.
DCF involves estimating the future cash flows a company will generate and then discounting them back to their present value. A dollar received in the future is worth less than a dollar received today.
This involves identifying an appropriate discount rate and time value. The discount rate on a FCFE model is the cost of equity because these cash flows belong to equity owners only and should thereby reflect the expected return (and risk) of solely equity capital. The time value can be any number of years into the future that the cash flows are being projected into. Years beyond the selected value are referred to as 'in perpetuity,' and they have their own long-term growth rate or exit multiple to calculate the terminal value.
Terminal Value - the value of an asset beyond the forecasted period when future cash flows can be estimated. It assumes that the business will continue to operate and grow at a set rate indefinitely after the forecast period.
Because this forms in large part a significant portion of the total assess intrinsic value of a company, the inputs are critical.
The use of a long-term growth rate should be chosen based on what rate one thinks the company will generate cash flows in perpetuity. The perpetuity growth rate usually ranges from the historical inflation rate of 2-3% to the historical GDP growth rate of 4-5%. Assuming a perpetuity growth rate above 5% implies an expectation that the company's growth will surpass the economy's growth indefinitely.
The use of an exit multiple assumes that the business will be sold at the end of the forecast period. In the LCFC model, the Price-to-Earnings (P/E) multiple is favored because it upholds consistency among the capital providers involved, which in this context, are solely equity holders. Essentially, the P/E multiple is a levered metric that considers debt, akin to the cost of equity.
This underscores the importance of inputs. The challenge of forecasting grows as the time horizon stretches into the future. Analysts usually employ a forecast period of three to five years, after which the precision decreases. The terminal value serves to estimate the company's worth past the forecast period, filling this gap.
Illustration using Wal-Mart WMT 0.00%↑
I will guide you through the analysis I have undertaken using the LFCF DCF model during the last fiscal year end (2023) for when Wal-Mart reported its financials. I did a full summary which can be found here.
Populating Historical Data
Creating a solid foundation of information initially requires time to compile historical financial data and input it into a spreadsheet. However, once this is established, you will only need to update one column with the results for each new fiscal year.
In my analysis, I've utilized historical data spanning the last five to six years (with some columns hidden for clarity in the following depiction in Exhibit I). This approach should yield a robust evaluation of past trends. I've limited the data range because the rapid pace of change and the tendency of companies to undergo quick evolutions make older data less relevant.
As a starting point, I typically rely on net income, provided it shows consistent and steady growth. If this criteria is not met, then I turn to revenues. Keep in mind that I do consider any one-time items or extraordinary events and adjust those accordingly.
Depreciation, amortization, and capital expenditures are directly obtained from the financial statements. The change in net working capital and debt repayment, however, require an additional step, as illustrated in the calculation tables below in Exhibit II.


Projections
The next step is to solidify your projections, such as in Column F in Exhibit I. To estimate net income or revenues, it's common to take a set of analyst estimates and calculate their average. Additionally, if you lean towards conservative investing, you might subtract a few percentage points, or conversely, add some if you're more optimistic.
All subsequent inputs are based on historical percentages of either net income or revenues, depending on your preference. These figures may vary, which is why we calculate the average over at least five years. Consider capital expenditures as an example. You would analyze the percentage of capex relative to your selected baseline for each of the past five years. This average would then serve as the basis for your future projections.
Note: Depreciation and amortization are closely linked to capital expenditures, which is why projections are often based on a percentage of capex. As for the line item 'debt repayment,' using the average debt-to-capital ratio could be an alternative method, provided that it remains consistent.
Once these are established, it is time to formulate the out-year projections using the most recent fiscal year-end as the starting point, as per Exhibit III.

Discounting to Present Value
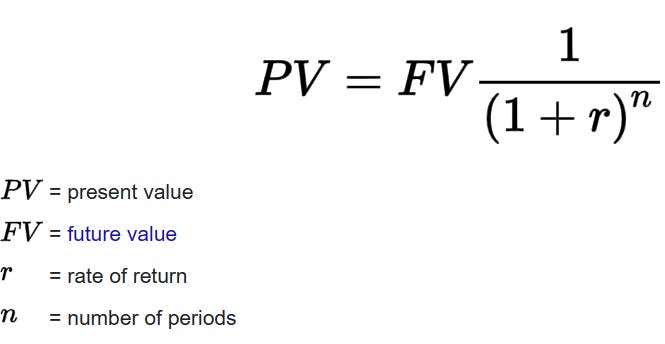
To determine the present value of future cash flows, the formula to be used is as follows:

As previously stated, the discount rate (r) to be used in this type of valuation method is the cost of equity. In order to calculate this, there are a few ways but the most widely used is the capital asset pricing model (CAPM). It considers three factors: the risk-free rate, beta, and equity risk premium. There are different variations to use for these factors, but the ones I normally leverage are as follows:
Risk-Free Rate (rf) - represents the 10-year government bond yield, which is determined by the location of the company's headquarters.
Beta (b) - measures the systematic, or volatility, risk. To simplify the process and save time, I directly obtain the information from the stock's page via an investing app or trading platform.
Equity Risk Premium (ERP): reflects the additional return expected from equities compared to risk-free assets. I follow Aswath Damodaran's philosophy and utilize his excellent, publicly accessible Excel spreadsheet that details the equity risk premiums by country. You may encounter companies who’s operations are spread across the globe and you may wonder which country to use. When companies report earnings, they tend to breakdown their revenues by geographical locations. You can do a simple mathematical equation to apply each country’s ERP against its allocation of revenue. The link can be found in the link below.
The rest is just plugging in the formula across the time period selected, preferably five years, to arrive at the PV.

Terminal Value
As explained earlier, there are two options to take to forecast cash flows beyond the period selected above: the perpetuity model or the exit multiple. These are depicted in Exhibit IV and their explanations on how to calculate follow.

Exhibit IV The Perpetuity Model
This is one of the biggest assumptions involved in this method. The perpetual growth rate is open for debate and can skew the results in either way. It needs to be realistic enough to highlight the sustainability of the company to main this consistent growth ‘indefinitely’.
The rate can be based on inflation or GDP, as outlined at the start of this article. Alternatively, it can be determined by evaluating the historical growth of comparable companies in the industry.
The WACC in this specific model would be the cost of equity.

The Exit Multiple
A more straight forward approach is to use a multiple like P/E. I would consider not only the average over a span of years, but also what the industry trades at among viable competitors.
The formula is as simple as multiplying the PV of future cash flows with the exit multiple above to arrive at the terminal value.
Both terminal value approaches undergo the same discounting process. Once we establish the PV cash flows for the initial five years and the terminal value, we then divide the total by the number of outstanding shares to determine the implied share price, or intrinsic value. The analysis is now complete.
Margin of Safety


This is solely an additional piece to my puzzle that I like to include. What is your margin of safety (MOS)?
MOS - the difference between the market price of a stock and its intrinsic value.
Why does this matter?
To account for errors in judgment or calculation within the analysis produced. At different levels across the MOS scale, your personal level of risk, or risk tolerance, is determined and a price target is established. Notably, legendary investor Warren Buffett has declared the MOS one of his “cornerstones of investing” and often applies a substantial discount to intrinsic value when setting his price targets.
Refer to the example below in Exhibit V. If your risk tolerance is high, then your MOS would likely fall on the lower end between 0% to 20%. On the other hand, a low risk tolerance may indicate a need for a more significant MOS. Once the price target within that MOS level is hit, it indicates a buy signal if you still believe that the stock fits your investment thesis.

Conclusion
Only those who are keen on holding individual stocks and have the time to engage in this type of analysis should truly understand the process of valuation. Please give a like and share to those who would most benefit from this. Thanks for reading!
Note: For assessing the value of real estate and financial stocks, such as banks, I would not advise employing this particular valuation method.
Disclaimer: The information provided in this valuation analysis is for educational and informational purposes only. It does not constitute financial advice or a recommendation to buy, sell, or hold any specific stocks or securities. The valuation model presented here relies on certain assumptions, including projected future cash flows and discount rates.
● Written with the help of Grok
Consider joining DiviStock Chronicles’ Referral Program for more neat rewards!Please refer to the details of the referral program.