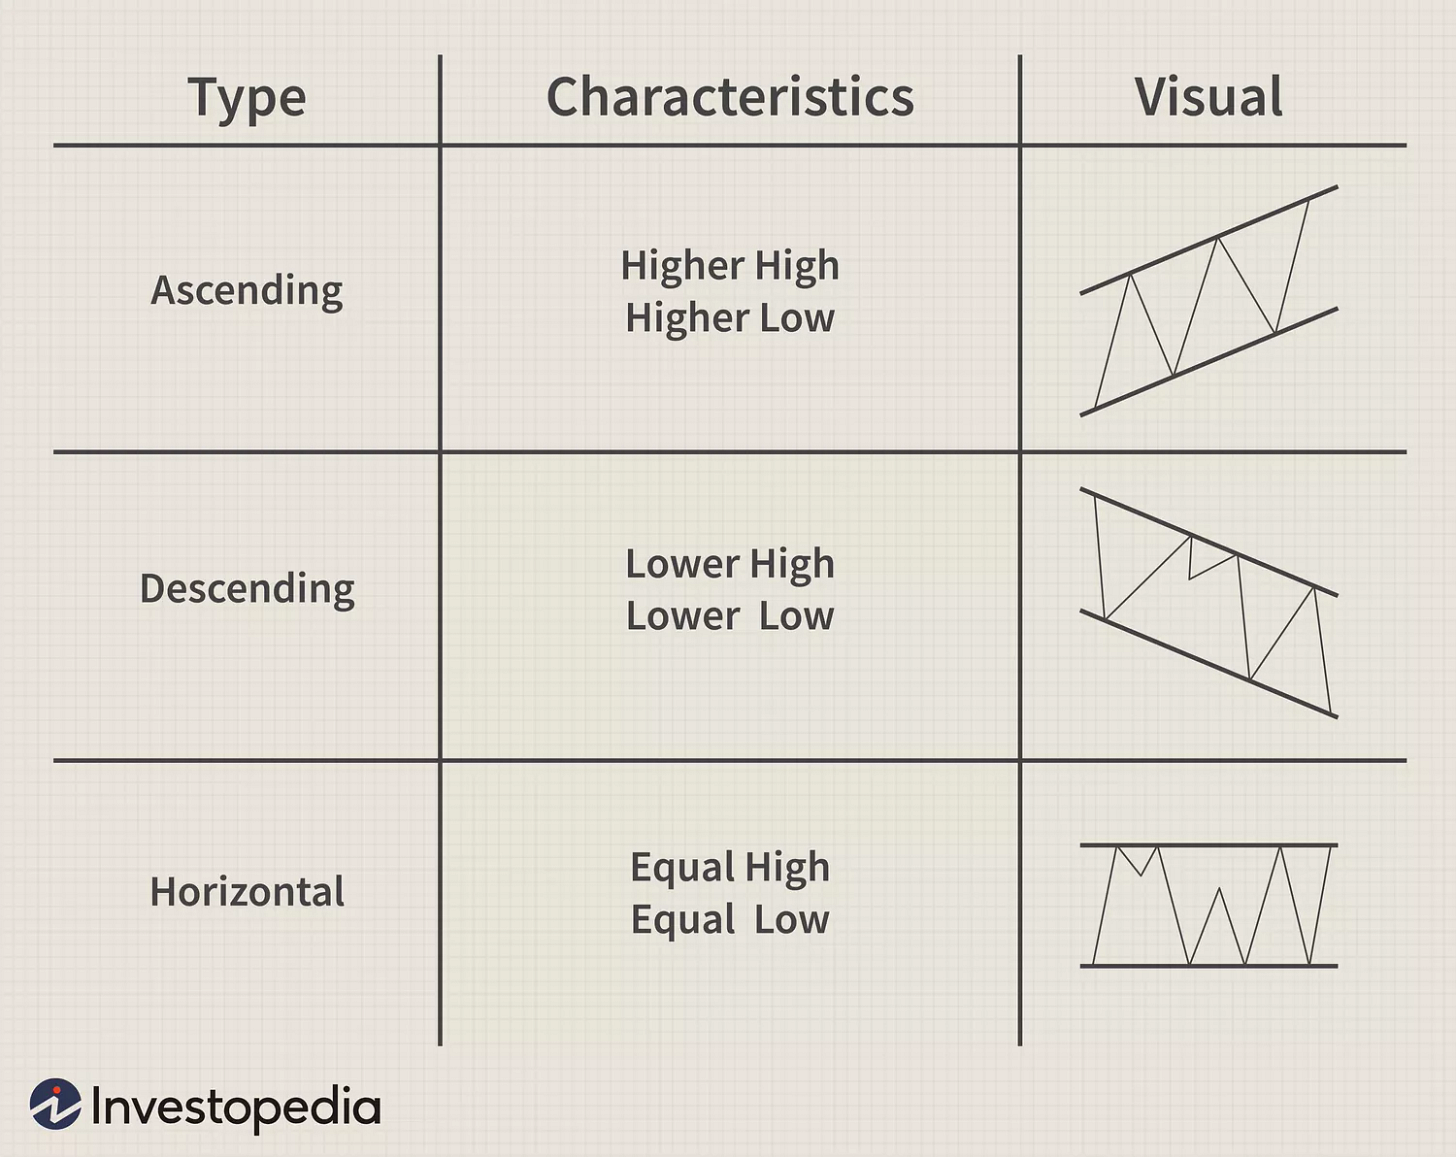
Parallel channels are formed by drawing two parallel trendlines on a price chart. The upper trendline connects the swing highs, while the lower trendline connects the swing lows. These channels can be ascending (indicating an uptrend), descending (indicating a downtrend), or horizontal (indicating a range-bound market).
For more indications on uptrend and downtrend breaks, consider my earlier blog posts below.
What to look out for?
Support and Resistance: The lower trendline acts as support, while the upper trendline acts as resistance. Prices often bounce between these boundaries.
Midpoint: The middle of the channel is also crucial. It acts as support when the price is in the upper range and as resistance when the price is in the lower range. If the price fails to break support, it signals strength. Conversely, if the price fails to break resistance, it signals weakness. This provides valuable insights into potential breakouts.
Breakouts: A breakout above the upper trendline can signal a potential uptrend, while a breakout below the lower trendline can indicate a potential downtrend.
Volatility: The width of the channel can indicate market volatility. Narrow channels suggest consolidation or range-bound conditions, while wider channels imply stronger trends.
Parallel channels can be a reliable tool when used correctly. The reliability of a channel increases with the number of times the price has rebounded from the top or bottom of the channel. Refer to the examples below for more insights.
1-2: Weak channel (not useful)
3-4: Adequate channel (minimally reliable)
5-6: Strong channel (reliable)
6+: Very strong channel (highly reliable)
For traders, the strategy is to buy at the bottom of the channel and sell at the top repeating the sequence. For investors, the bottom presents an opportunity to add to their positions, while a confirmed breakdown is a signal to take some profits.
However, like any technical analysis tool, they are not foolproof and should be used in conjunction with other indicators and analysis methods. Market conditions, trading psychology, and external factors can all impact the effectiveness of parallel channels.
Illustrations
Dollarama (DOL)
Dollarama is a clear example of a parallel channel. In fact, you can identify two instances within the same timeframe. The first image shows a narrower channel with more touches at the bottom. An important learning point in this illustration is the failed breakdown. Midway through, the channel broke down but did not confirm, quickly tracing back up into the channel and negating the breakdown. As a result, it continued its upward trajectory. Retest and confirmation are valuable tools to consider in these patterns when assessing their validity.
In the wider channel, we see fewer touches at the bottom but no failed breakout. This highlights the importance of considering all the candlesticks when forming a parallel channel. In this case, the failed breakdown in the previous chart could have been seen as part of the channel’s normal fluctuations. As for the actual breakdown, we observe an attempt to retest and break back up, which ultimately failed, leading to a drawdown.
As a result, Dollarama (DOL) is now in a downtrend, heading towards its 200-day moving average (represented by the thin blue line). The RSI on the daily chart is also very low, suggesting a potential bounce if it reaches the 200-day target.
From a longer-term perspective, such as the weekly chart, we now see verification of the breakdown, with a potential retest of the $140ish mark. After this, we will assess whether this parallel channel breakdown was a false signal or if it will validate the downtrend and continue moving lower.
Brookfield Corp. (BN)
Brookfield was on a strong run until recently, when a weakening in its rise emerged. We observe a crossover of two parallel channels—one ascending and one descending. At the end of the first parallel channel (highlighted blue), without even considering the second parallel channel (highlighted yellow), we can identify a weakness. On the final touch at the bottom, it failed to rise to the midpoint and began consolidating in the lower range. This weakness signals an inability to push the stock price to greater highs, as seen in this instance.
BN has now broken the ascending channel and is in the retesting phase. If it cannot break back into the ascending (blue) channel, the descending (yellow) channel will be confirmed.
Current Active Channels
Canadian Natural Resources (CNQ)
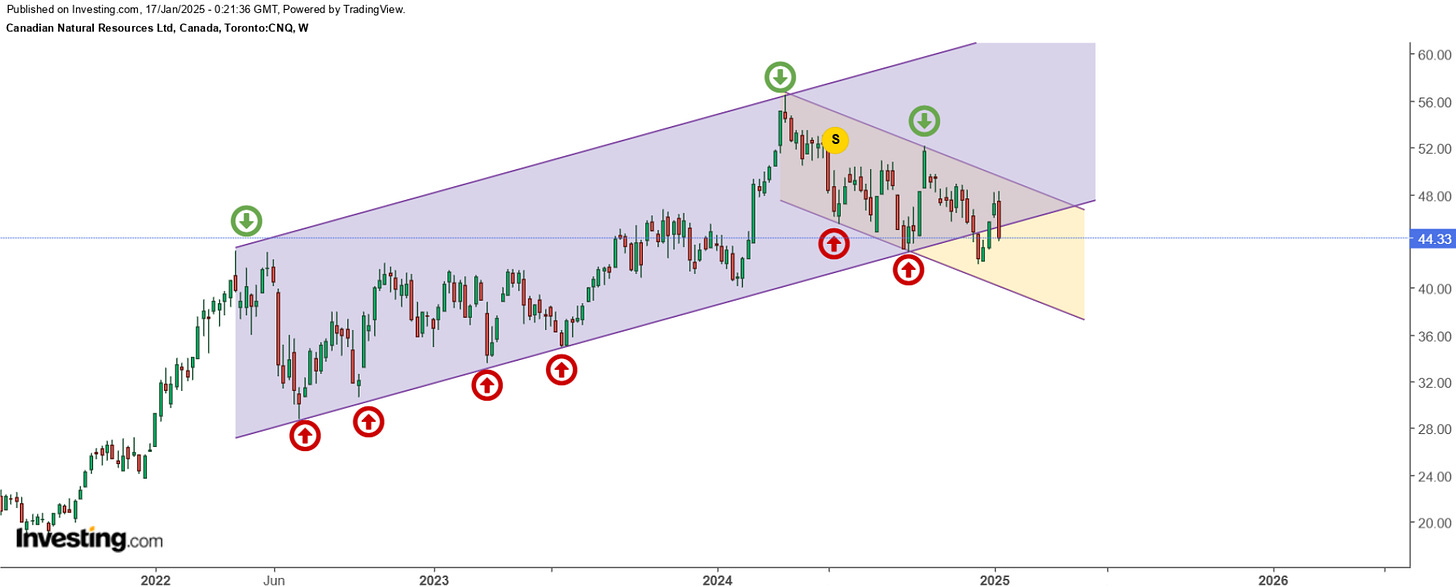
A crossover between an ascending and descending channel is occurring for CNQ. It recently broke the ascending channel but has since regained its position within it. This could indicate a retest or a potential fake out. Further candles are needed to confirm the direction.
Brookfield Renewable Partners LLP (BEP)
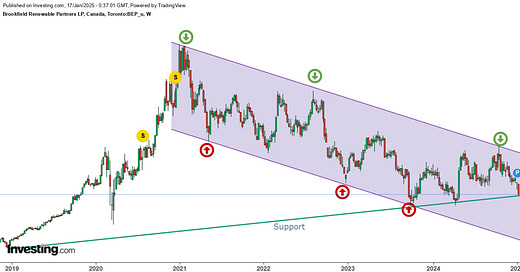
Since reaching its all-time high in 2021, BEP (BEP.UN) has been experiencing a significant downtrend, illustrated by a descending parallel channel that has been touched evenly on both ends. An interesting development is the consolidation phase that it has been in for over a year. Notably, it has now hit the support line (marked in green) for the third time. The stock might either continue to consolidate, potentially breaking to the upside, or if the support fails, it may continue within the descending channel, indicating further trouble.
Disclaimer: The information provided is for educational and informational purposes only. It does not constitute financial advice or a recommendation to buy, sell, or hold any specific stocks or securities.
Consider joining DiviStock Chronicles’ Referral Program for more neat rewards!Please refer to the details of the referral program.


