The Price Is Right? Simple Ways to Value Stocks
A simple guide to valuing stocks and avoiding overpriced investments.
Investing in stocks isn’t just about finding great companies—it’s about making sure you’re not paying too much for them. Even amazing businesses can turn into disappointing investments if you buy at sky-high prices. That’s where valuation comes in. This article breaks down simple ways to figure out whether a stock is fairly priced, undervalued, or overpriced. Regardless of whether you are a novice or an experienced investor, gaining understanding of these techniques can enable you to make more informed decisions and prevent expensive errors.
1. Dividend Yield Theory
This method uses a stock’s dividend yield (annual dividend per share divided by stock price) to assess whether it is undervalued or overvalued. A higher-than-average yield may indicate undervaluation, while a lower yield suggests overvaluation, assuming stable dividends. It’s a simple, quick way to compare dividend-paying stocks within an industry.
Key Points
Best for stable, dividend-paying companies.
Compares a stock’s yield to historical averages or industry peers.
Ignores growth potential and non-dividend-paying stocks; assumes dividend stability.
Example
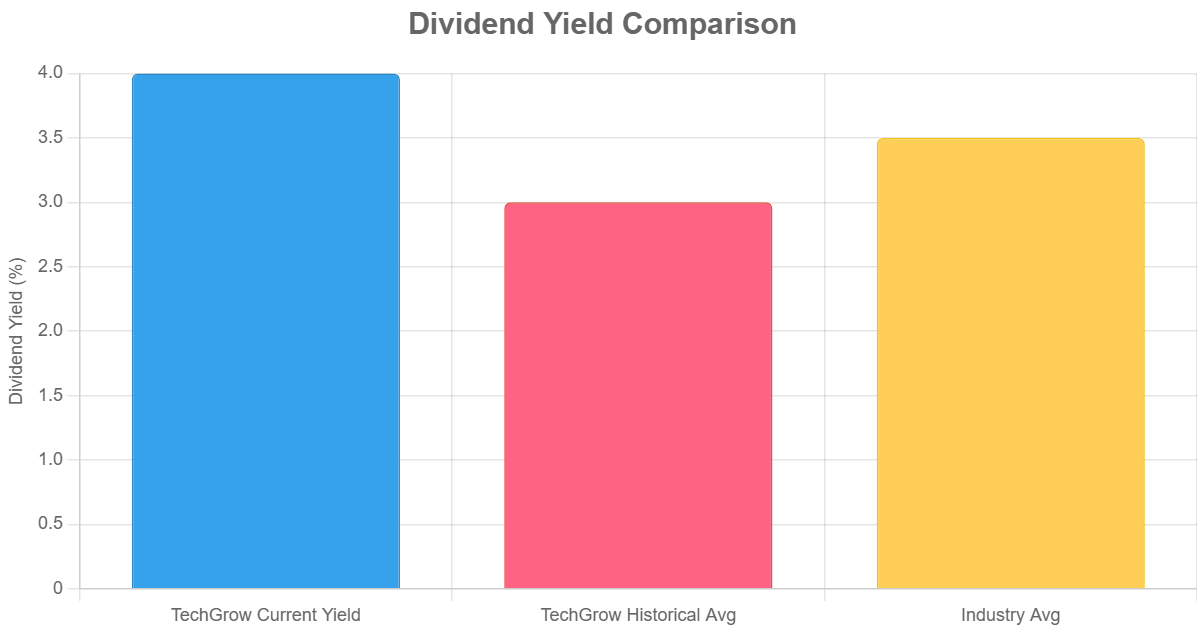
TechGrow Inc.1 is a mature tech company with a stable dividend. Its current stock price is $50, and it pays an annual dividend of $2 per share, yielding 4% ($2/$50).
Historically, TechGrow’s dividend yield has averaged 3% over the past 10 years, and the industry average is 3.5%.
Since the current yield (4%) is higher than both its historical average (3%) and the industry average (3.5%), the stock may be undervalued, suggesting a potential buying opportunity. To confirm, we’d check fundamentals like dividend sustainability and compare with peers.
Steps:
Calculate current dividend yield: $2 / $50 = 4%.
Compare to historical yield (3%) and industry average (3.5%).
Higher yield suggests undervaluation, but verify with other metrics like the payout ratio (e.g., 30-70% of earnings, indicating sustainability).
2. Historical Multiples Valuation
This approach evaluates a stock by comparing its current valuation multiples (e.g., P/E, P/B, P/S) to its own historical averages. If the current multiple is lower than the historical average, the stock may be undervalued, and vice versa.
Key Points
Relies on metrics like Price-to-Earnings (P/E), Price-to-Book (P/B), or Price-to-Sales (P/S).
Assumes past multiples reflect a stock’s “normal” valuation.
Historical data may not account for changes in market conditions, company fundamentals, or industry trends.
Example
TechGrow’s current P/E ratio is 15, with a stock price of $50 and earnings per share (EPS) of $3.33 ($50/$3.33).
Over the past 10 years, its P/E has averaged 20.
Assuming no major changes in fundamentals, a P/E of 20 suggests an intrinsic value of $3.33 × 20 = $66.60, indicating the stock is undervalued at $50. We’d also check if the lower P/E reflects temporary issues or market conditions.
Steps:
Current P/E: $50 / $3.33 = 15.
Historical P/E average: 20.
Intrinsic value: EPS × Historical P/E = $3.33 × 20 = $66.60.
Compare: Current price ($50) < Intrinsic value ($66.60).
3. Bogle’s Valuation
Pioneered by John Bogle, this method estimates a stock’s future returns based on three components: initial dividend yield, expected earnings growth, and changes in valuation multiples (e.g., P/E ratio). It’s often applied to broad market indices like the S&P 500 to predict long-term returns.
Key Points
Formula → Expected Return = Dividend Yield + Earnings Growth Rate ± Change in P/E Ratio.
Focuses on long-term market or stock performance.
Relies on accurate growth forecasts and assumes stable market conditions.
Example
For TechGrow, assume a current dividend yield of 4%, expected EPS growth of 6% annually, and an expected P/E expansion from 15 to 18 over 10 years. Using Bogle’s model, expected annual return = Dividend Yield + Earnings Growth + Annualized P/E Change. The P/E change is approximated as [(18/15)^(1/10) - 1] ≈ 1.84%. Thus, expected return = 4% + 6% + 1.84% = 11.84% annually. This suggests TechGrow is a good investment if the required return is lower.
Steps:
Dividend yield: 4%.
Earnings growth: 6%.
P/E change: (18/15)^(1/10) - 1 = 1.84%.
Total expected return: 4% + 6% + 1.84% = 11.84%.
4. Comparable Multiples Valuation
This relative valuation method compares a stock’s valuation multiples (e.g., P/E, P/B, EV/EBITDA) to those of similar companies in the same industry. If a stock’s multiples are lower than its peers, it may be undervalued.
Key Points
Requires identifying comparable companies with similar size, growth, and risk profiles.
Common multiples include P/E, P/S, P/CF, and EV/EBITDA.
Differences in company specifics (e.g., debt, growth rates) can skew comparisons.
Example
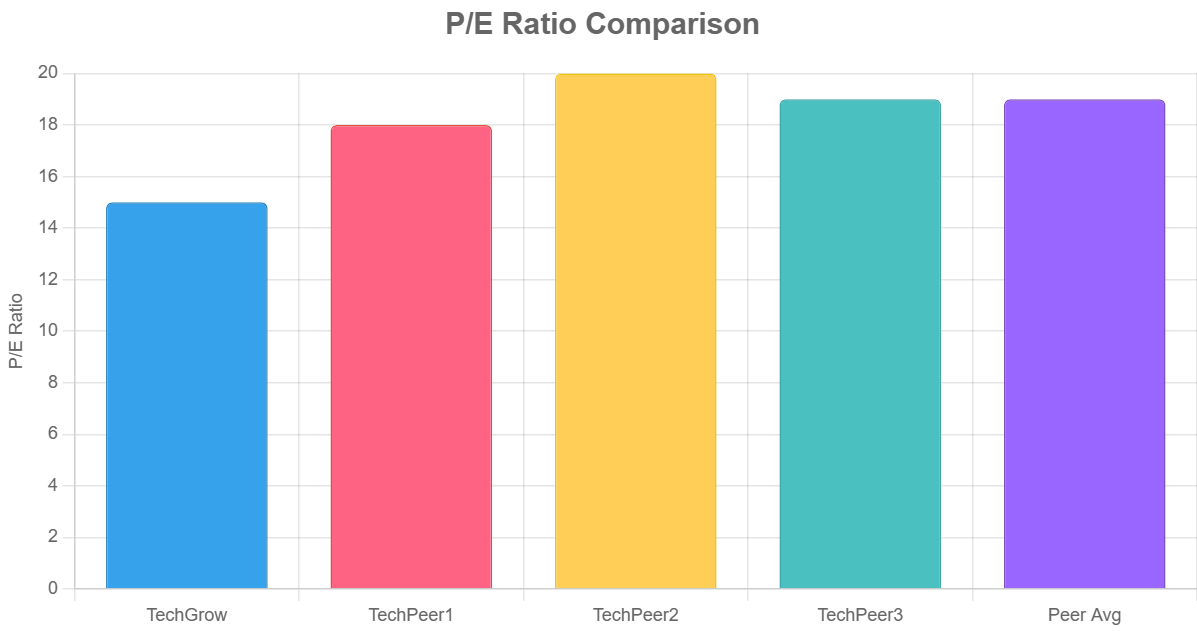
TechGrow’s P/E ratio is 15, while three peer companies (TechPeer1, TechPeer2, TechPeer3) have P/E ratios of 18, 20, and 19, averaging 19. TechGrow’s EPS is $3.33. Using the peer average P/E of 19, intrinsic value = $3.33 × 19 = $63.27, suggesting TechGrow is undervalued at $50. We’d ensure peers are comparable in size, growth, and risk.
Steps:
TechGrow P/E: 15.
Peer P/E average: (18 + 20 + 19) / 3 = 19.
Intrinsic value: $3.33 × 19 = $63.27.
Compare: Current price ($50) < Intrinsic value ($63.27).
5. Dividend Discount Model (DDM)
The DDM calculates a stock’s intrinsic value by discounting its expected future dividends to their present value. It assumes dividends grow at a constant rate and uses a discount rate to reflect risk.
Key Points
Formula → Value = Dividend per Share / (Discount Rate - Dividend Growth Rate).
Best for stable, dividend-paying companies with predictable growth.
Inapplicable to non-dividend stocks; sensitive to growth and discount rate assumptions.
Example
TechGrow pays a $2 annual dividend, expected to grow at 5% annually. The required rate of return (discount rate) is 10%. Using the Gordon Growth Model, intrinsic value = Dividend / (Discount Rate - Growth Rate) = $2 × (1 + 0.05) / (0.10 - 0.05) = $2.10 / 0.05 = $42. At $50, the stock appears overvalued, but we’d check dividend sustainability.
Steps:
Next year’s dividend: $2 × 1.05 = $2.10.
DDM formula: $2.10 / (0.10 - 0.05) = $42.
Compare: Current price ($50) > Intrinsic value ($42).
6. Reverse DCF Analysis
A variation of the Discounted Cash Flow (DCF) model, reverse DCF starts with the current stock price and works backward to determine the growth rate or cash flows implied by that price. It helps assess whether market expectations are reasonable.
Key Points
Uses current price to estimate implied growth rates or cash flows.
Helps investors understand market assumptions embedded in the stock price.
Requires assumptions about discount rates and terminal values; complex calculations.
Example
TechGrow’s stock price is $50, with current free cash flow (FCF) of $5 per share. Using a 10% discount rate and 5% terminal growth rate, we calculate the implied FCF growth rate. Assume a 10-year forecast period and terminal value. Reverse DCF shows the market implies a 7% annual FCF growth rate to justify $50. If we believe TechGrow can grow FCF at 10%, it’s undervalued.
Steps:
Current price: $50.
Assume FCF ($5) grows at rate g for 10 years, discounted at 10%, plus terminal value.
Solve for g where PV of cash flows = $50; yields g ≈ 7%.
Compare to expected growth (e.g., 10%).
7. Discounted Cash Flow (DCF) Analysis
DCF estimates a stock’s intrinsic value by forecasting future free cash flows (FCF) and discounting them to the present using a discount rate (often WACC). It accounts for a company’s ability to generate cash over time.
Valuation Methods
When it comes to valuing stocks, investors have a plethora of methods at their disposal. From the discounted cash flow model in its number of variations to the dividend discount model, each method has its own strengths and weaknesses, and there’s no one-size-fits-all approach.
Key Points
Steps: Forecast FCF, estimate terminal value, apply discount rate, sum present values.
Flexible for growth companies or those without dividends.
Highly sensitive to assumptions about growth rates, discount rates, and terminal values.
Example
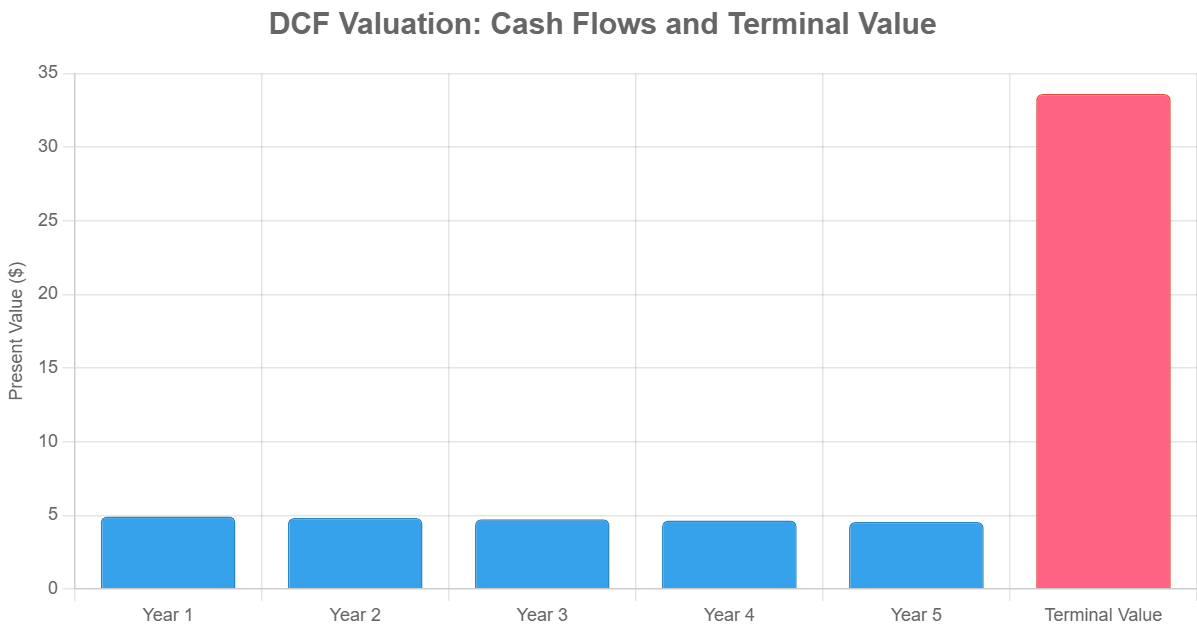
TechGrow’s FCF is $5 per share, expected to grow at 8% for 5 years, then 3% perpetually. The discount rate (WACC) is 10%. Forecast FCF for 5 years, calculate terminal value, and discount to present. Total intrinsic value = $56.48, suggesting undervaluation at $50.
Steps:
Year 1-5 FCF: $5 × (1.08)^1 = $5.40, $5.83, $6.30, $6.80, $7.34.
Terminal value (Year 6 onward): $7.34 × (1.03) / (0.10 - 0.03) = $107.99.
Discount cash flows and terminal value at 10%:
PV of FCFs: $5.40/1.1 + $5.83/1.1^2 + … + $7.34/1.1^5 = $22.87.
PV of terminal value: $107.99/1.1^5 = $33.61.
Total intrinsic value: $22.87 + $33.61 = $56.48.
● Written with the help of GrokConsider joining DiviStock Chronicles’ Referral Program for more neat rewards!Please refer to the details of the referral program.A hypothetical company used to illustrate the examples.


