


Bullish and Bearish Divergences using RSI
Understanding Divergences with RSI for Beginners

Bullish Divergence
Definition: Occurs when the price of an asset makes a lower low, but an oscillator, like RSI, makes a higher low.
Indication: Suggests that the downtrend is losing momentum and a reversal to an uptrend might be imminent.
Example: If a stock's price drops to a new low, but the RSI forms a higher low, it indicates that the selling pressure is weakening, and buyers might step in soon.
Bearish Divergence
Definition: Occurs when the price of an asset makes a higher high, but an oscillator makes a lower high.
Indication: Suggests that the uptrend is losing momentum and a reversal to a downtrend might be imminent.
Example: If a stock's price rises to a new high, but the RSI forms a lower high, it indicates that the buying pressure is weakening, and sellers might take control soon.
Hidden Divergence
There are also hidden divergences, which are the opposite of regular divergences, but these can be harder to find:
Hidden Bullish Divergence: Price makes higher lows, but RSI makes lower lows, indicating a potential continuation of an upward trend.
Hidden Bearish Divergence: Price makes lower highs, but RSI makes higher highs, indicating a potential continuation of a downward trend.
Here is a clear visual to help you understand:

Illustrations
ASML Holding (ASML)
Here is a clear depiction of a regular divergence in both directions. Toward the end of 2022, the RSI began to turn upward (higher low) while the price continued to decline (lower low), signaling a bullish potential reversal to the upside. The price then broke out into a new uptrend until the next divergence. The RSI started showing a downtrend (lower highs) while the stock price kept climbing (higher highs), signaling a bearish potential reversal to the downside. Case in point.

Canadian National Railway (CNR)
Let's examine CNR's performance from November 2022 to 2023. Throughout this period, the stock was mired in a downtrend. However, a bullish divergence emerged towards the end. For simplicity, I track the trend's trajectory, comparing each high (low) point of the stock price to the RSI's direction. If both move in the same direction from one point to the next, the trend is likely to continue. This was true for CNR, which remained in a downtrend for a year. It wasn't until the final low that a noticeable RSI divergence appeared. I've marked this divergence with a red 'X' below. Despite the stock price decreasing at the last data point, the RSI increased, signaling a bullish divergence. Subsequently, the stock rallied to an all-time high.

Now, CNR appears to be in a similar trend once again, this time from March 2023 to the present. Both the stock price and RSI trends aligned throughout this period. However, the RSI started to level off unusually towards the end, as indicated by the question mark. The divergence was confirmed by an identical set-up to the one described above: the RSI increased while the stock price hit a new low in the downtrend (first ‘X’). However, there is a slight hidden divergence emerging, where a lower high in the stock price coincided with a higher high in the RSI (second ‘X’). Will the bullish trend be confirmed or denied?

Amazon.com Inc (AMZN)
Now, these divergences can persist for extended periods until the price breaks. AMZN provides a great example. From July 2020 to April 2022, AMZN traded sideways with a slight upward trend, while its RSI exhibited a downward trend. This is illustrated by the red arrows at the top of each indicator. There was no issue holding the stock during this period, but the technicals suggested a bearish divergence. When the RSI neared its bottom, the channel broke, and the signal proved accurate.
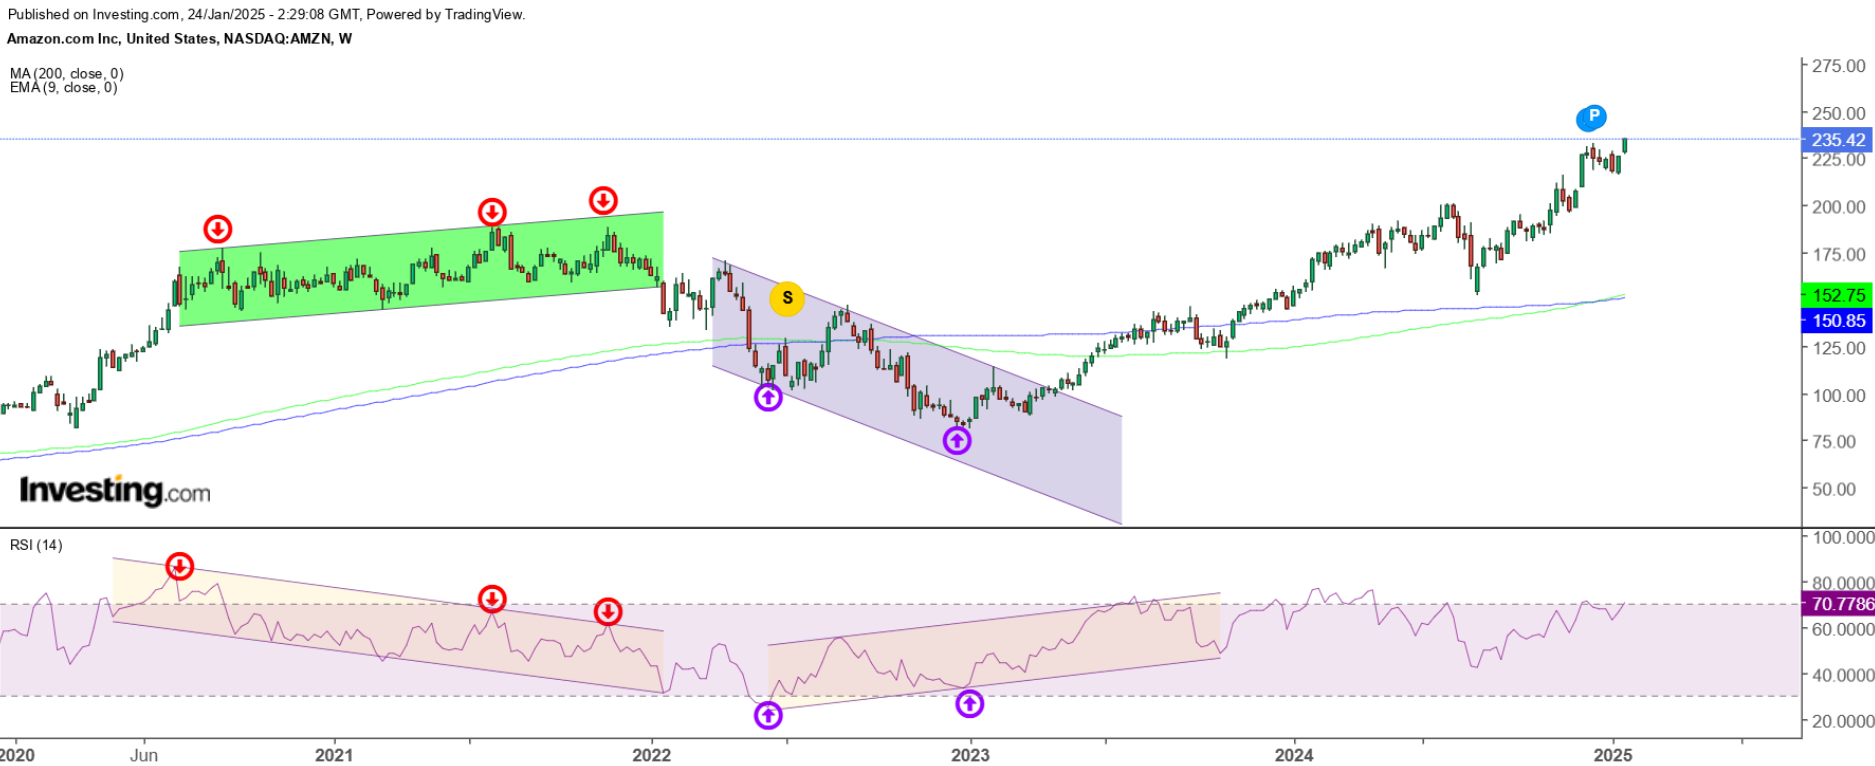
Following this, AMZN entered a downtrending channel for nearly three-quarters of 2023. However, another divergence appeared—this time bullish, indicated by the purple arrows at the bottom of each indicator. Once this bullish divergence was confirmed, the stock climbed to new all-time highs.
Nvidia Corporation (NVDA)
Just remember that time periods can vary—they can be long or short. NVDA is a prime example of how each data point is critical and needs continuous assessment for changes. Apply the knowledge you've gained and understand the patterns illustrated below.

I like to use this in conjunction with trendlines and parallel channels. This approach helps confirm the probability of an impending breakout or breakdown. As a long-term investor, it assists me in deciding whether to take some profits off the table or accumulate more of my long-term holdings. But remember it is not always foolproof, and any trend can continue for a very long-time before it unravels, so if you truly believe in that company or ETF, make an informative decision without considering the technicals behind it. Stick with the fundamentals!


Consider joining DiviStock Chronicles’ Referral Program for more neat rewards!Please refer to the details of the referral program.