April Charts Wrap-up
Insights and Patterns: A Monthly Dive into Stock Chart Analysis for the Average Investor
While my investing focus is often on fundamentals, there's a wealth of insight to be gained from simple stock chart patterns. In this monthly series of blog posts, I'll break down some straightforward yet perceptive chart patterns that can be identified in a select group of individual stocks. These patterns have been previously taught in earlier blog posts, which you can find at the end of this article. As always, exercise your own discretion and judgment when making financial decisions, as this is not investment advice.
S&P 500
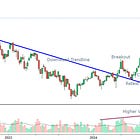
March recap: The blue line stands out as a key point of interest. While a breakdown to new lows is possible, it does not necessarily signal the start of a bear market. This could turn out to be a false move. Upon retesting the blue line, we can assess whether it breaks back above.
Everyone loves the S&P 500 so let’s begin here. April was the month of tariffs. Yes, a sharp downturn in fast fashion led to a couple weeks of recovering back to the same level. Did I not say that it would retest this blue line?
Once again, market sentiment reacts to headlines with fear and overreaction, while fundamentals bring things back into perspective. The opportunity to add passed as the stock approached its 200-week moving average (MA). For a deeper understanding of why this level is one of the best places to add, revisit my previous article on moving averages.
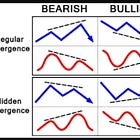
Looking ahead, May will determine the next move—either a decisive break above this key level or a continued downtrend back toward the 200-week MA. A catalyst will be necessary to drive such a move, and given the hidden bearish divergence pattern, I anticipate a near-term pullback. However, the ultimate direction will depend on external factors. Trade deal rumors could send the market higher, but concerns remain over economic instability, particularly following the contraction in U.S. GDP for Q1.
Quick Review of U.S. Q1 GDP
U.S. GDP growth turned negative in Q1 2025 (-0.37%), primarily due to a massive drag from net exports (-4.83%) caused by tariff frontrunning and a smaller negative contribution from government spending (-0.25%). Despite strong personal consumption (1.21%) and fixed investment (1.34%), these negative factors overwhelmed the positives.
Here is a more comprehensive breakdown:
- Personal Consumption (Yellow): This is consistently the largest positive contributor to GDP, except in this quarter. In Q1 2025, it contributed 1.21%, meaning consumer spending added decently to GDP growth. Consumer spending remains a strong driver of economic activity.
- Fixed Investment (Dark Blue): This includes business investments in equipment, structures, etc. It generally contributes positively, around 0.5% to 1.34%. In Q1 2025, it adds 1.34%. Businesses are still investing, likely in response to the investments in AI and data centres.
- Private Inventories (Green): This reflects changes in business inventories, which surged 2.25%, as expected, on the pre-tariff restocking.
- Net Exports (Light Blue): This is calculated as exports minus imports. It’s often negative because the U.S. typically imports more than it exports (a trade deficit). In Q1 2025, it’s a massive negative at -4.83%, the largest drag on GDP, circled on the chart. This was likely driven by tariff "frontrunning"—importers rushing to bring in goods before anticipated tariffs increase costs.
- Government (Red): Government spending’s contribution varies. It’s mostly positive or neutral but turns negative in Q1 2025 at -0.25%, the first negative contribution since early 2022.
Gold (GLD)
March recap: GLD remains within this parallel channel formation, defying expectations of a small pullback as it steadily climbs to new all-time highs (ATHs). While a pullback might seem inevitable, there are compelling reasons to believe GLD could reach even greater ATHs.
GLD has surged to new all-time highs in this volatile month and is now entering a period of consolidation. I anticipate a retest of the top of its long parallel channel around $3,200. Its recent strength has been supported by a weaker U.S. dollar (noted by the purple index line), as the two often move inversely—a trend worth watching in May.
Longer term, I expect gold to continue its ascent, driven by ongoing de-dollarization efforts and the U.S.'s rising, unsustainable debt levels. China continues to accumulate gold while reducing its U.S. treasury holdings, further reinforcing this trend. However, if a deal is struck between the U.S. and China, market stability could return, causing gold's rally to pause temporarily.
Bitcoin (BTC)
March recap: However, there appears to be significant support around the $70K level. While the unfolding of this scenario remains uncertain, those considering allocating a portion of their portfolio to cryptocurrency—specifically BTC—might view this potential development as an opportunity to enter the market.
As noted last month, the $70K level appeared to be a significant support zone. Bitcoin surged to $75K, presenting a solid opportunity to add exposure. Interestingly, while the S&P 500 declined, Bitcoin did not follow—a surprising divergence. But the real story lies in its correlation with the QQQ (NASDAQ-100 performance). Take a look at the similarities in their movements—because QQQ rallied in April, Bitcoin followed suit. This reinforces that Bitcoin remains closely tied to the QQQ.
Currently, there is a bullish flag forming and with Microsoft (MSFT) and Meta Platforms (META) having crushed their earnings call, it looks like both the index and Bitcoin are about to pull higher. The chance to add seem to have passed for now, but the upside still seems interesting.
Schwab US Dividend Equity ETF (SCHD)
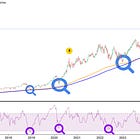
If you enjoy dividends, SCHD should be in your list as a solid dividend ETF. I will keep this one simple - the 200-week moving average. Look at all the hits on the thin, blue line since 2016. It is back at that stage with increasing volume and a low RSI. If you have done your due diligence and believe this ETF is a good long-term hold, it might be the time to sprinkle in some cash for a 4% yield.
Alimentation Couche-Tard (ATD)
March recap: If the sentiment was not so dire, this would be a great time to initiate a position in ATD.
ATD held above the uptrend line, instead bouncing off the bottom of the downtrend parallel channel before retreating back up. While the industry shows no signs of strength, ATD remains a high-quality company with exceptional capital allocation.
Once again, the stock came close to brushing its 200-week moving average. Given that the company’s fundamental quality and intrinsic nature remain unchanged, this presented another opportune moment to add.
The chart below highlights ATD’s dividend yield over the past five years alongside its stock price. Historically, a sharp rise in yield relative to the stock price has signaled a potential buying opportunity. While broader macroeconomic factors must be taken into account, this perspective remains compelling.
Apple (AAPL)
Another lesson on the 200-week moving average. If you believed Apple remained a fundamentally strong and high-quality company—and saw the sharp pullback as justified due to the threat of tariffs on China, where much of its production and revenue originate—then considering an entry at its touchpoint on the 200-week MA in April would have been a reasonable move for your portfolio. Investment thesis in tact, reaching a great technical point, adding for the long-term.
Microsoft (MSFT)
February recap: The stock is currently in a downward trend, yet it has shown strong support around $380, a level that has withstood multiple tests. If this support were to break, ~$350 could be the next target, which coincides with the 200-week moving average (…) Notably, when the RSI reaches a specific lower threshold, it has consistently highlighted favorable buying opportunities.
And just as the technicals suggested, the $380 support level broke, leading the stock down to the next support at $350. With a notably low RSI and proximity to the 200-week moving average, multiple factors pointed to a potential long-term entry for MSFT. Now, after a stellar earnings beat, the stock is poised to rebound toward the top of the downward trendline (pink) before its next move.
Canadian National Railways (CNR)
Where do I even begin with CNR? This is a long-term investment of mine, favoured for its unparalleled railroad network that cannot be replicated. However, it has been trading as though the global flow of goods has ceased for over a year now. It is entrenched in a severe downtrend channel, one of the worst in its entire history. Analyzing the chart reveals that it has never been this significantly below its 200-week moving. During the COVID pandemic, it was 12% below that level. Currently, it sits 16% below. With the earnings report set to be released on May 1st, we'll soon find out what impact it may have. Clearly, something is off.
Disclaimer
The content provided on this page by the publisher is not guaranteed to be accurate or comprehensive. All opinions and statements expressed herein are solely those of the author. Trading stocks can incur losses of the invested capital. Even all capital can be lost. This page represents my personal strategies, views, and decisions, which may not be appropriate for other investors. Please use common sense or consult with an investment professional before investing your money.
Consider joining DiviStock Chronicles’ Referral Program for more neat rewards!Please refer to the details of the referral program.


