


Take Eight - Random Investing Notes
A collection of insightful investment pieces to broaden knowledge and elevate the investing mindset. Includes: 2024 US Market Review, Concentration Risk, Retail Sales Trajectory, Earnings vs. S&P500

2024 US Market Review
The S&P 500 saw an exceptional bull market in 2024, boasting a 25% return. As depicted in the image below, NVIDIA emerged as the largest positive contributor, accounting for 22.4% of the index's overall return. Other notable contributors were Amazon (+7.4%), Meta (+5.9%), and Alphabet (+5.5%). On the downside, CVS Health (-0.4%), Boeing (-0.6%), Adobe (-0.7%), and Intel (-1.3%) were the largest detractors from the S&P 500's performance.

The best-performing sectors in the S&P 500 in 2024 were:
Communication Services: This sector, driven by companies like Alphabet (Google) and Meta (Facebook), saw significant growth.
Information Technology: This sector continued its strong performance, benefiting from the ongoing advancements in artificial intelligence.
Financials: This sector also did exceptionally well, benefiting from higher interest rates and solid economic growth. It saw a significant rise in net interest margins for banks.
Consumer Discretionary: This sector, encompassing areas like retail and travel, also experienced substantial growth. This sector includes companies like Walmart and Costco, which had impressive gains.
The worst-performing sectors in 2024 was:
Materials: This sector, which includes companies involved in mining and raw materials, faced challenges due to factors like China's economic slowdown and rising interest rates.
Real Estate: This sector faced challenges and was one of the weaker performers in the S&P 500.
Energy: The volatility in oil and gas prices impacted this sector, leading to a lower total return.
2025 may just turn these sector results on their head. What's your outlook for the year ahead?
Concentration Risk
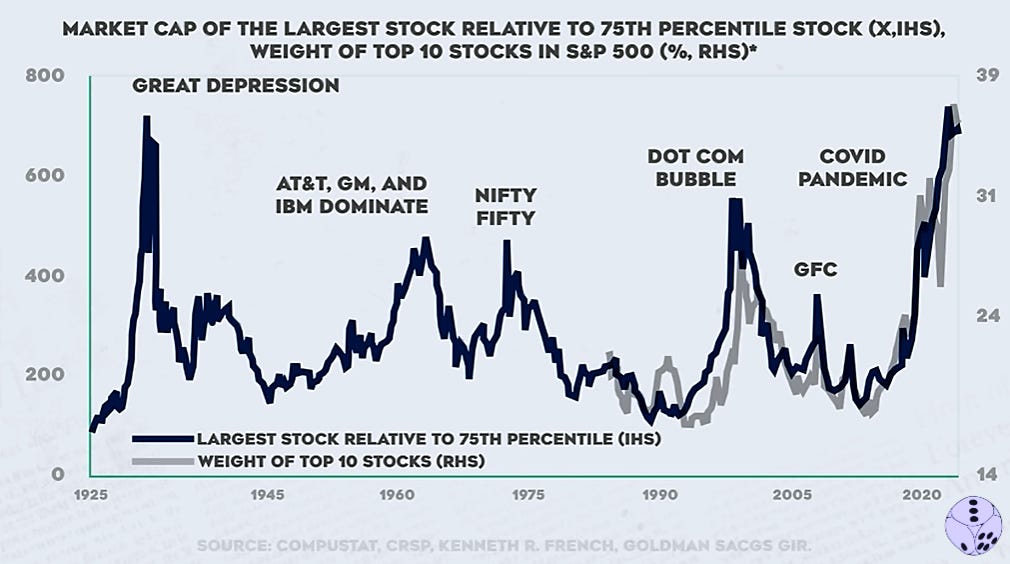
This graph illustrates the impact of the weight of the top 10 stocks in the S&P 500 for 2024, including giants like Microsoft, Apple, Nvidia, Google, Amazon, Meta, and others. By examining similar periods of high concentration in the past, we can observe consistent patterns. Do you know what happened next? The essential takeaway is that a high concentration of assets within a portfolio significantly increases risk.
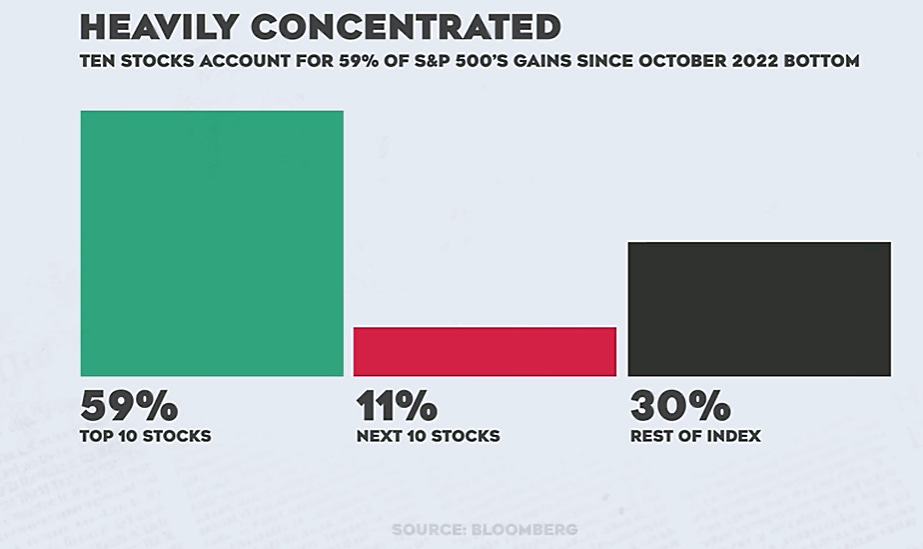
Here’s another chart to consider. Since the market bottomed in October 2022, nearly 60% of the index’s performance has been driven by the top 10 stocks. If you subscribe to the theory of reversion to the mean, you’ll need to hope that the remaining 40% of stocks can deliver improved returns in 2025. Matching these gains again in 2025 will be a significant challenge. As mentioned in the previous edition, the outlook for 2025 depends on earnings exceeding expectations; otherwise, we could face a substantial correction.
Retail Sales Trajectory
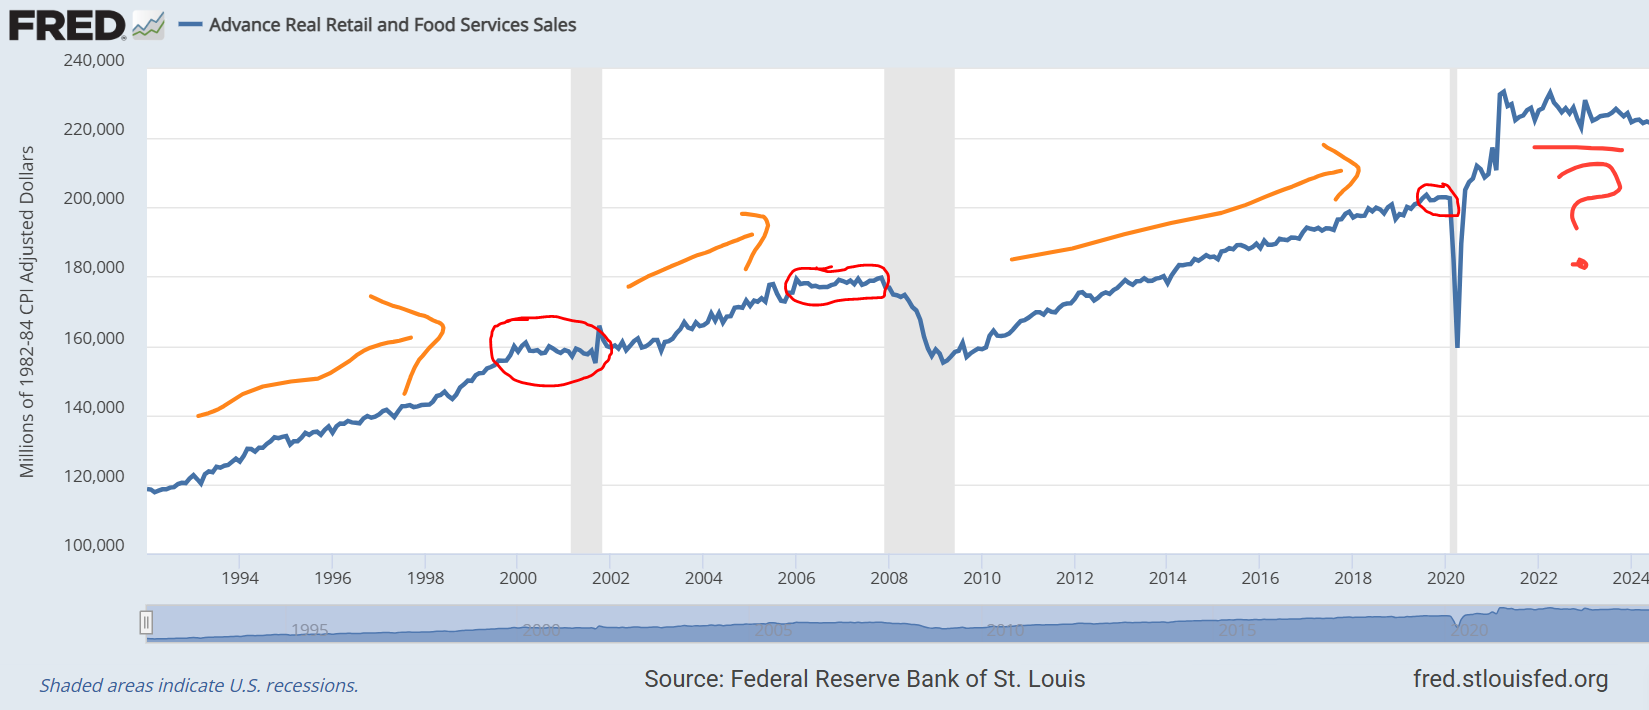
Although this chart focuses on the US, it presents an intriguing insight. The shaded areas signify periods of recession. What can be observed before these recessions? Retail sales typically stagnated and failed to grow. This pattern of stagnation has been evident since 2021. Could this be a sign of an impending recession, suggesting that the US market might face some challenges? Only time will tell.
Earnings Matter
Market distractions happen every year - interest rates, geopolitical tensions, consumer price index readings, Federal Reserve decisions, and other risks. All create volatility in the system. But in the end, it is always about earnings. They are the true market mover.
“In the short run, the market is a voting machine; in the long run, it is a weighing machine.” - Benjamin Graham

Past Editions

Includes: 1) S&P 500 Valuation, 2) Canada’s Weak Economy, 3) Investment Vehicles in Canada, & 4) Diversification

Includes: 1) Yield Curve Inversion, 2) Tech Bubbles, 3) Gold vs. Treasuries, and 4) VIX.

Includes: 1) Trade Balances, 2) Deflation from China, 3) Global Reserve Currency, and 4) 2024 US Election Aftermath.

Includes: 1) S&P 500 Historical Growth, 2) Risk Terminology, 3) WFH Case, and 4) CRE Debt Crisis.

Includes: 1) Purchasing Power, 2) Global Liquidity, 3) Currency Debasement, 4) Hurdle Rate, and 5) Liquidity Cycles.

Includes: 1) Tough Industries to Invest In, 2) First Rule of Compounding, 3) CDN Focused Portfolios, and 4) Beta.

Includes: 1) MOATs, 2) Portfolio Recession Crashes, 3) Capital Allocation, and 4) CDN vs US Dividend Growers.
Consider joining DiviStock Chronicles’ Referral Program for more neat rewards!
Please refer to the details of the referral program below.
Invite your friends to read DiviStock Chronicles

Thank you for reading DiviStock Chronicles — your support allows me to keep doing this work. Join our referral program!