


The Federal Funds Rate
Understanding the Federal Funds Rate: A Key Driver of Economic Policy

What is the Federal Funds Effective Rate?
The Federal Funds Effective Rate is the interest rate that banks charge each other to borrow money overnight. It’s a key tool used by the U.S. central bank, the Federal Reserve (the Fed), to influence the economy1. Think of it as the starting point for many other interest rates in the economy—like the rates you pay on a car loan, mortgage, or the interest you earn on your savings account2.
Why does it Exist?
Banks are required by law to keep a certain amount of money in reserve at the Federal Reserve to ensure they can handle withdrawals and other demands. At the end of each day, some banks might have extra reserves, while others might be short. Banks with extra reserves lend to those that need more, and the interest rate they charge for these overnight loans is the federal funds rate.
How Does the Fed Control the Federal Funds Rate?
The Fed doesn’t directly set the federal funds rate but influences it by setting a target range (for example, 5.25% to 5.5%). They use a few tools to keep the actual (effective) rate within this range:
Open Market Operations
The Fed buys or sells government bonds (called Treasuries) in the open market.
Buying Bonds: When the Fed buys bonds, it pays banks for them, which injects money into the banking system. This increases the supply of reserves, making it easier for banks to lend to each other, which lowers the federal funds rate. Think of this as quantitative easing.
Selling Bonds: When the Fed sells bonds, banks pay the Fed, which takes money out of the system. This reduces reserves, making borrowing more expensive, and pushes the federal funds rate up. Think of this as quantitative tightening.
Interest on Reserves
The Fed pays banks interest on the reserves they keep at the Fed. By adjusting this rate, the Fed can encourage banks to either hold onto their reserves (if the rate is high) or lend them out (if the rate is low), influencing the federal funds rate.
Discount Rate
This is the rate the Fed charges banks to borrow directly from it (through the "discount window"). It’s usually a bit higher than the federal funds rate. If the discount rate is raised, banks are more likely to borrow from each other instead, which can push the federal funds rate up.


The actual federal funds effective rate is calculated daily by the Federal Reserve Bank of New York, based on the average rate of all overnight loans between banks.
Why Does the Federal Funds Rate Matter?
The federal funds rate is like a thermostat for the U.S. economy. The Fed adjusts it to either heat up or cool down economic activity.
It Affects Borrowing Costs Across the Economy
The federal funds rate is the foundation for many other interest rates. When it changes, it ripples through the economy.
For example, if the federal funds rate goes up, banks pay more to borrow from each other. To cover that cost, they raise the rates they charge you for loans (like mortgages, credit cards, or car loans). At the same time, they might offer you a higher interest rate on your savings account because they’re competing for your money.
If the rate goes down, borrowing becomes cheaper, and saving earns you less interest.
It Influences Economic Growth
Low Rates Stimulate Growth: When the Fed lowers the federal funds rate, borrowing is cheaper, so people and businesses are more likely to take out loans to buy houses, start businesses, or invest. This increases spending and can help the economy grow, especially during a recession.
High Rates Slow Things Down: When the Fed raises the rate, borrowing gets more expensive, which can discourage spending and investment. This is often done to cool off an economy that’s growing too fast and causing high inflation (when prices for goods and services rise too quickly).
It Impacts Inflation
Inflation happens when there’s too much money chasing too few goods, causing prices to rise. If the economy is overheating (growing too fast), the Fed might raise the federal funds rate to make borrowing more expensive, which slows spending and helps bring inflation down.
On the flip side, if inflation is too low or the economy is sluggish, the Fed might lower the rate to encourage spending and boost prices a bit.
It Affects Your Investments
As a beginner investor, the federal funds rate can impact your portfolio in several ways:
Stocks: When rates are low, companies can borrow cheaply to grow, and investors often prefer stocks over low-yielding savings accounts, driving stock prices up. When rates rise, borrowing costs increase for companies, and bonds (which now offer higher yields) become more attractive, so stock prices might fall.
Bonds: Bond prices move inversely to interest rates. If the federal funds rate rises, new bonds will offer higher yields, making older bonds with lower yields less valuable, so their prices drop.
Savings and CDs: Higher rates mean you’ll earn more on savings accounts or guaranteed investment certificates (GICs), but lower rates mean you’ll earn less.
How Does This Affect You as a Beginner Investor?
If Rates Are Rising:
Loans: If you’re thinking of borrowing money (for a car, house, or student loan), it’ll be more expensive. You might want to wait if you can.
Savings: Higher rates are good for savers. Look for high-yield savings accounts or CDs to earn more interest.
Stocks: Some stocks (especially growth stocks, like tech companies) might struggle because they rely on borrowing to grow. Value stocks (like banks or utilities) might do better.
Bonds: If you own bonds, their prices might drop as new bonds with higher yields become available. But if you’re buying new bonds, you’ll get better returns.
If Rates Are Falling:
Loans: Borrowing is cheaper, so it might be a good time to take out a mortgage or refinance existing loans.
Savings: You’ll earn less on savings accounts, so you might want to invest in other assets like stocks.
Stocks: Stocks often rise when rates fall because companies can borrow cheaply, and investors seek higher returns in the stock market.
Bonds: Existing bonds with higher yields become more valuable, so their prices go up.
Watching the Fed:
The Fed meets about eight times a year to decide on the federal funds rate. These meetings are closely watched by investors because a change in the rate (or even a hint of a future change) can move markets.
For example, if the Fed says it plans to raise rates to fight inflation, you might see stocks drop as investors worry about slower economic growth.
Does the Federal Funds Rate Control All Yields?
To some extent, but the longer length of debt, the less influence it has. While historical data suggests that yields often follow the Fed’s interest rate direction, more factors come into play on the long end of the yield curve. I have previously explained this in one of my articles.

Recently, we observed that when the Fed began cutting rates, the long-term yield actually rose in the opposite direction. The Trump administration aims to prevent the 10-year yield from exceeding 5%, as such a scenario could undermine Trump’s economic plans and negatively impact the economy, including the equities market.
Relationship to the Long-Term Debt Cycle
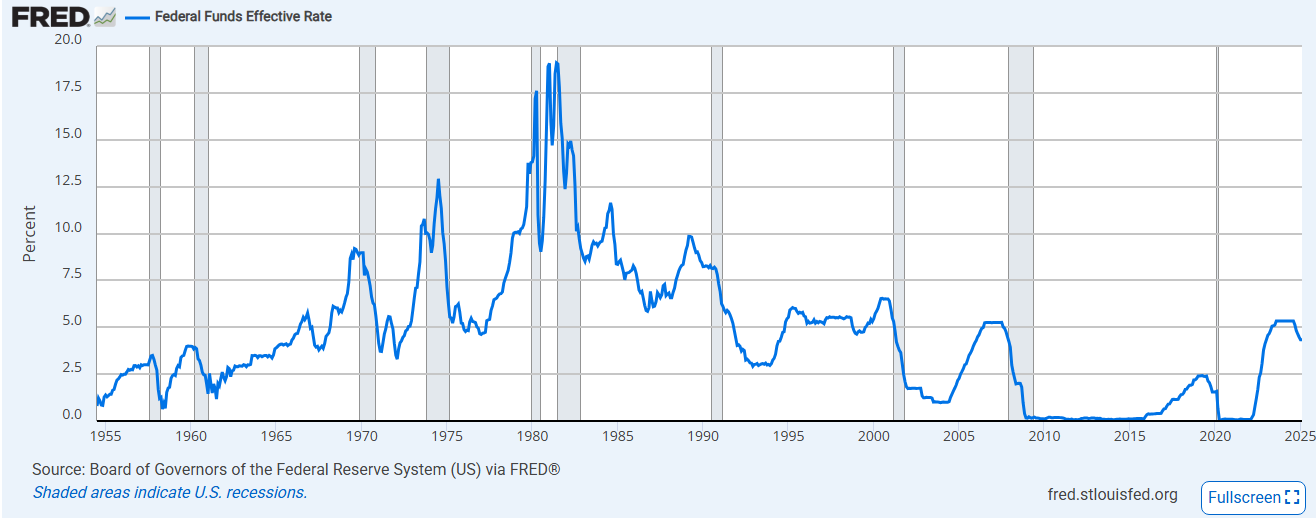
The Federal Funds Effective Rate is published and can be tracked daily. The y-axis represents the interest rate in percentage terms (ranging from 0% to 20%), and the x-axis shows the timeline from 1955 to 2023. Shaded areas on the graph indicate U.S. recessions.
Explanation of the Graph
1955–1970s: Rising Rates with Volatility
The Federal Funds Rate starts near 0% in 1955 and gradually rises with some fluctuations. For the most part, the economy was stable, and inflation wasn’t a big issue. Low rates encouraged borrowing and growth.
By the late 1960s and into the 1970s, rates become more volatile, reflecting economic challenges like inflation and the Vietnam War. The rate spikes to around 10% during this period, coinciding with inflationary pressures.
Late 1970s–Early 1980s: Peak Rates
The most dramatic spike occurs in the late 1970s and early 1980s, where the rate peaks at nearly 20%. This was a time of high inflation (called stagflation), caused by oil price shocks and other factors. The Fed, under Chairman Paul Volcker, raised rates aggressively to make borrowing so expensive that it slowed the economy and brought inflation under control. However, this also caused recessions (shaded areas on the graph).
This period also sees two recessions (shaded areas around 1980 and 1982), partly triggered by the high interest rates that slowed economic activity to curb inflation.
1980s–2000s: Declining Trend with Fluctuations
After the early 1980s peak, the Federal Funds Rate trends downward but remains volatile, fluctuating between 3% and 10%.
Recessions in the early 1990s and early 2000s (dot-com bubble burst) are visible, with the Fed lowering rates to stimulate the economy during these downturns.
2008–2015: Near-Zero Rates
Following the 2008 financial crisis, the Fed slashes rates to near 0% (a policy known as Zero Interest Rate Policy, or ZIRP) to support the economy. Rates remain at this level for an extended period, reflecting the severity of the Great Financial Crisis (GFC) and the slow recovery.
2015–2020: Gradual Increases, Then a Drop
Starting around 2015, the Fed begins raising rates gradually as the economy recovers, peaking at around 2.5% by 2019.
In 2020, rates drop back to near 0% in response to the COVID-19 pandemic, as the Fed again seeks to stimulate the economy during a sharp downturn.
2022–2023: Sharp Increase
Starting in 2022, the rate rises sharply, reaching around 5% by 2023. This reflects the Fed’s response to high inflation following the pandemic, driven by supply chain issues, stimulus spending, and other factors.
Connection to the Long-Term Debt Cycle
The long-term debt cycle, a concept popularized by economist Ray Dalio3, describes how debt levels in an economy grow over decades, leading to periods of expansion, over-leveraging, and eventual deleveraging (often through recessions or financial crises). The Federal Funds Rate graph can be tied to this cycle in the following ways:
Debt Accumulation During Low-Rate Periods
When interest rates are low (e.g., 1950s–1960s, 2008–2015, 2020), borrowing becomes cheaper, encouraging individuals, businesses, and governments to take on more debt. This fuels economic growth but also increases leverage in the system.
For example, the near-zero rates after 2008 led to a significant increase in corporate and government debt as entities borrowed to recover from the financial crisis.
Rising Rates and Deleveraging
As debt levels become unsustainable, inflationary pressures often emerge, prompting the Fed to raise interest rates (e.g., late 1970s, 2022–2023). Higher rates increase the cost of borrowing, making it harder to service existing debt.
This often leads to deleveraging, where borrowers reduce debt by paying it down, defaulting, or restructuring. The early 1980s recessions, triggered by Volcker’s high rates, are a classic example of deleveraging, as high borrowing costs forced a reduction in debt levels.
Recessions as a Reset Mechanism
The shaded recession areas on the graph often align with periods of deleveraging. For instance, the 2008 financial crisis was a major deleveraging event, as over-leveraged banks and households faced defaults and bankruptcies. The Fed’s response—slashing rates to 0%—helped ease the burden but also set the stage for a new debt accumulation phase.
Long-Term Cycle Patterns
The long-term debt cycle typically spans 50–75 years, culminating in a major deleveraging event (like the Great Depression or the 2008 crisis). The graph shows a broad pattern of rising rates in the 1970s–1980s (a response to earlier debt buildup), followed by a long decline in rates as the economy deleveraged and then re-leveraged.
The sharp rate hikes in 2022–2023 suggest we might be entering another deleveraging phase, as high inflation forces the Fed to tighten policy, potentially straining highly leveraged entities (e.g., corporations with cheap debt from the 2010s).
Impact on Future Cycles
The current high-rate environment (2023) could mark the beginning of a new phase in the long-term debt cycle. If rates remain elevated, it may force deleveraging, potentially leading to a recession (though none is shaded in 2023 on this graph). Alternatively, if the Fed lowers rates again to avoid a downturn, it could prolong the debt buildup, delaying the inevitable deleveraging.
Summary
The Federal Funds Rate graph illustrates how monetary policy responds to economic conditions, which are deeply tied to the long-term debt cycle. Low rates encourage debt accumulation, leading to economic booms but also over-leveraging. When the Fed raises rates to combat inflation or overheating, it often triggers deleveraging, which can result in recessions. The historical pattern in the graph—low rates in the 1950s, high rates in the 1980s, near-zero rates post-2008, and recent hikes in 2022–2023—mirrors the phases of debt accumulation, overextension, and deleveraging in the long-term debt cycle. Understanding this relationship helps explain why economic booms and busts occur and how central banks influence these cycles through interest rate policies.


Consider joining DiviStock Chronicles’ Referral Program for more neat rewards!Please refer to the details of the referral program.