


Costco - A Retail Juggernaut - FY24
As companies start to reveal their earnings for the fiscal year 2024, here are the results for a stock on my shortlist along with a business valuation.

Welcome to my summary of Costco’s (COST) earnings report for fiscal 2024. For additional context, please refer to my earlier post detailing my valuation methodology.


Year-End Results
Costco’s (COST) continues its growth in all facets: memberships, warehouses, e-commerce. As a result, comparable sales were all positive throughout its worldwide locations. Positive results for a strong company. As long as the economy remains expensive, shoppers will increasingly depend on it—even though inflation has decreased, the financial strain is still noticeable.
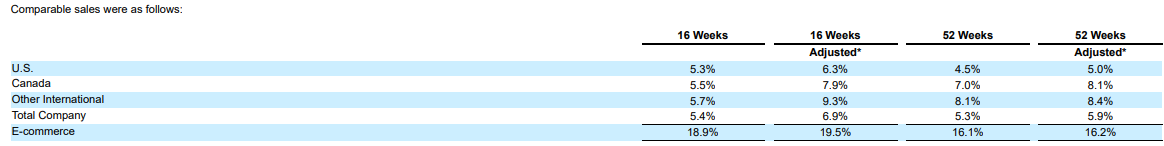
Revenues saw a 5% increase.
Earnings per share (EPS) increased by 17%.
Dividends per share (DPS) increased by 14%, plus a special one-time dividend of $15 issued.
Operating cash flow (OCF) was $11.3 billion, and free cash flow1 (FCF) was $6.6 billion.
The payout ratio stayed steady at 26%.
The long-term debt to equity ratio was 0.44.
The annualized average share price growth was +24% over 5 years, +24% over 3 years, and +40% over the last year.
The count of outstanding shares largely remained unchanged.

Diluted EPS Growth - Absolutely Beautiful!

Investor Presentation Highlights
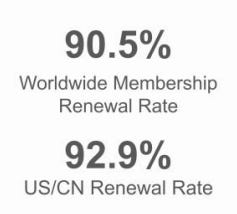
Customer Loyalty. The bulk pricing strategy and membership model ensure a consistent revenue flow and enhance customer loyalty. With the membership fee increase that took effect on September 1st, 2024, provided that membership renewals stay constant, the revenue from these fees will surpass that of the fiscal year 2024.
Membership Growth: The company ended Q4 with 76.2 million paid household members, a 7.3% increase from last year. Executive memberships grew by 9.6%.

Supply Chain Powers. By placing larger orders, Costco can secure even more favorable deals from suppliers, which translates to lower prices for shoppers. Consequently, the rise in membership fees essentially reimburses itself through the savings customers experience.
Building shareholder and customer value through expansion and e-commerce improvements.
New Openings: Costco opened 29 net new warehouses in fiscal 2024, including their first in Maine and their 600th in the U.S.
International Expansion: They plan to open 29 more warehouses in fiscal 2025, with 12 outside the U.S including their 5th warehouse in Spain.

Change in Number of Warehouses Technology Enhancements: Improvements like warehouse inventory checks via the Costco app is a huge deal for shoppers!

My Own Valuation
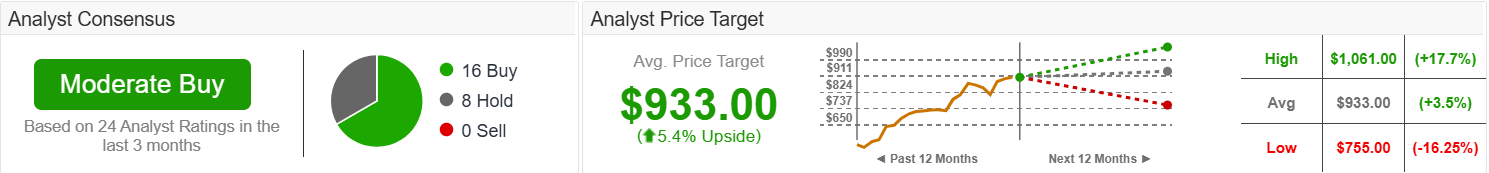
COST commands a significant premium for good reason. It boasts a robust dividend triangle, characterized by increasing revenue, earnings, and dividends, and has established a unique retail model unmatched by others. Yet, trading at such elevated levels means that merely good performance is insufficient. For COST to reach new all-time highs, it must exceed expectations significantly. As evidenced by the recent earnings report, even satisfactory performance led to a decline in share price, highlighting the risks associated with purchasing stocks at peak prices with steep valuations.
Even with a conservative growth estimate factored in, a premium was incorporated into the terminal value calculation to ensure balance. However, the valuation fell short of its current market price, further confirming the premium already reflected in the price. In the end, valuations are what you make of it.

While COST remains on my watchlist and has for some time, I would only consider investing significantly if there were a major pullback. It's improbable that the price will see a substantial correction in the current economic climate, which it benefits from. However, should the entire market decline, taking everything with it, COST merits attention as the company is likely to continue thriving and its expansion goals remain attainable within its business segment. Monitoring membership renewals and expansion objectives will be key indicators to watch.
Net Income Growth: The spreadsheet presents a growth estimate that reflects the company's anticipated rise in net income for the upcoming five years, based on the average of projections from multiple analysts. The estimate is additionally adjusted down to reflect a more conservative approach.
Free Cash Flow to Equity (FCFE): This is calculated for several years, showing the amount of cash that could be distributed to shareholders after all expenses, reinvestment, and debt repayments.
Discounted Cash Flow (DCF) Valuation: The spreadsheet includes a DCF valuation section, which is a method used to estimate the value of an investment based on its expected future cash flows. It provides two valuation methods:
Perpetuity Growth: Calculated using a long-term growth rate and discounting future cash flows.
Exit Multiple: Based on an exit price-to-earnings (P/E) multiple.
Current Share Price vs. DCF Value: A table compares the current share price of ATD with the estimated share price based on DCF valuation, suggesting whether the stock is undervalued or overvalued according to the model.
Disclaimer: The information provided in this valuation analysis is for educational and informational purposes only. It does not constitute financial advice or a recommendation to buy, sell, or hold any specific stocks or securities. The valuation model presented here relies on certain assumptions, including projected future cash flows and discount rates.
Other FY24 Reviews


Free Cash Flow (FCF) is essentially Operating Cash Flow (OCF) minus capital expenditures. This figure may differ from the FCF reported in the company's financial statements.
Consider joining DiviStock Chronicles’ Referral Program for more neat rewards!
Please refer to the details of the referral program below.
Invite your friends to read DiviStock Chronicles

Thank you for reading DiviStock Chronicles — your support allows me to keep doing this work. Join our referral program!