


February Charts Wrap-up
Insights and Patterns: A Monthly Dive into Stock Chart Analysis for the Average Investor

While my investing focus is often on fundamentals, there's a wealth of insight to be gained from simple stock chart patterns. In this monthly series of blog posts, I'll break down some straightforward yet perceptive chart patterns that can be identified in a select group of individual stocks. These patterns have been previously taught in earlier blog posts, which you can find at the end of this article. As always, exercise your own discretion and judgment when making financial decisions, as this is not investment advice.
S&P 500
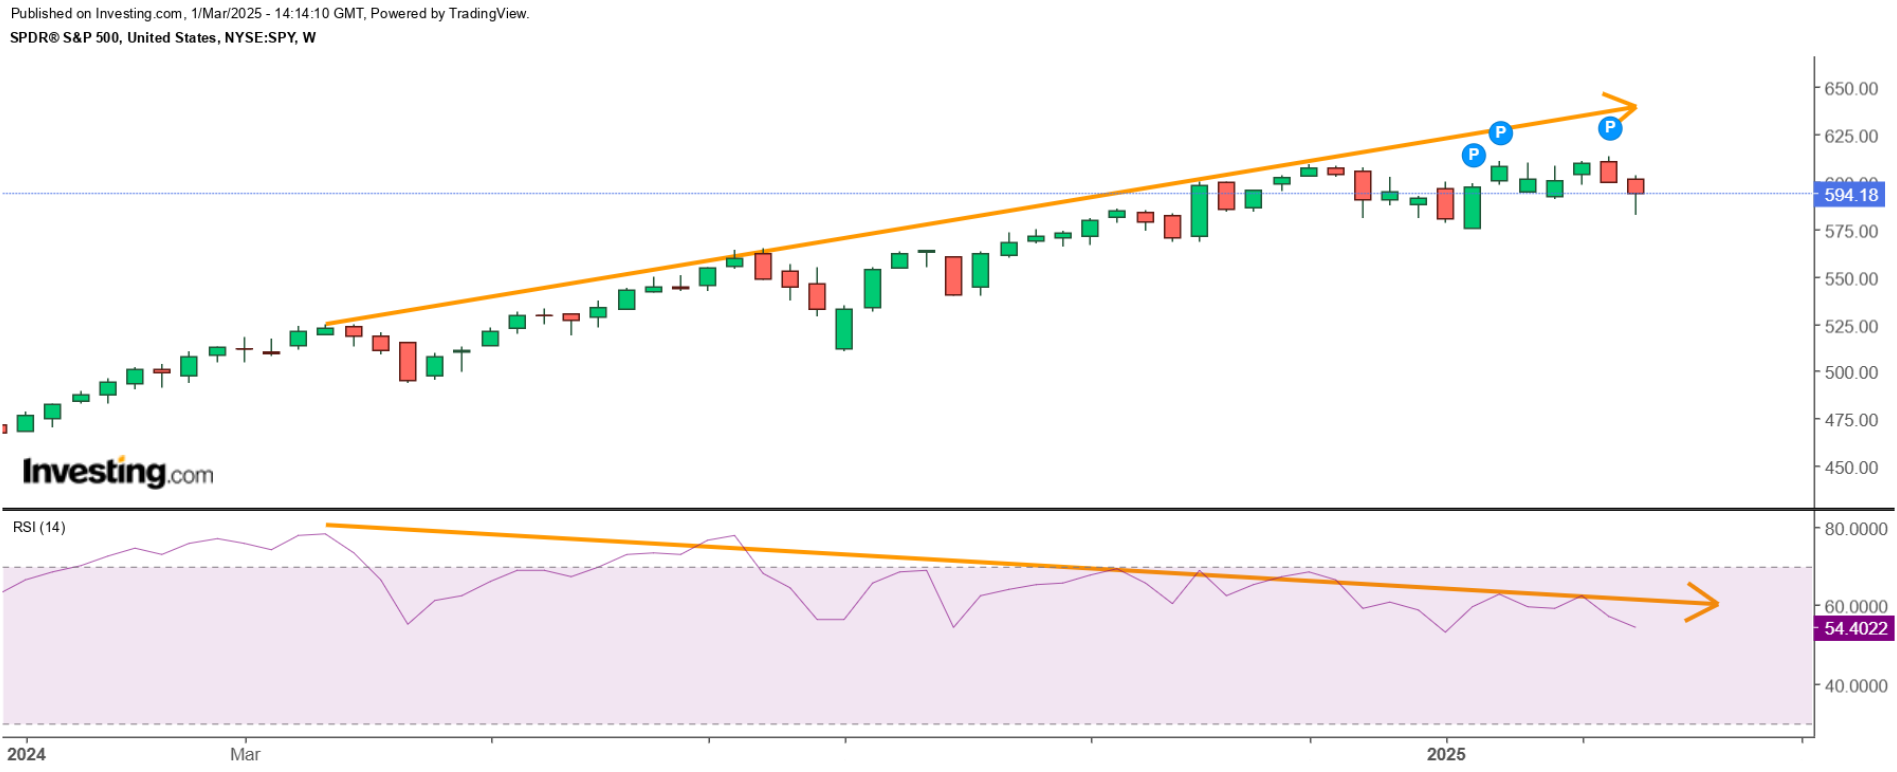
Let’s start with the world’s most popular index, the S&P 500 (SPX). Despite numerous signals of economic strain, the SPX has demonstrated remarkable resilience. The Fear and Greed Index currently sits at the lower end of fear, reflecting cautious sentiment. Meanwhile, the yellow line in the chart below, representing global liquidity, has been trending downward for some time. Yet, the SPX remains near its all-time highs.

This dynamic could shift dramatically if quantitative easing is reintroduced. However, such a move would likely stoke inflation, drive yields higher and ultimately offer little benefit to the markets overall. Additionally, the SPX has been grappling with a bearish divergence on the RSI since early 2024. A healthy correction to the $5,200–$5,700 range could provide much-needed balance, as the current outlook doesn’t support further upward momentum.

Interestingly, Trump and Bessent appear focused on addressing the challenges left by Biden’s administration. They’ve expressed willingness to endure short-term market struggles in exchange for potentially greater gains six to twelve months down the line.
Gold (GLD)
This year could potentially see GLD reach new highs, driven by persistent inflationary pressures and other economic warning signs, such as the unsustainable burden of rising debt. The recent RSI trend indicated a pullback, which began this past week with the appearance of a red candle—breaking an eight-week streak of higher prices. Notably, GLD continues to trade within its established parallel channel.
If you believe GLD still has room to climb, monitoring this channel could prove insightful. As observed during the previous RSI high, GLD retreated to the bottom of the channel before beginning its next upward move. We may now be in a similar phase. My GLD position has grown steadily this year, and if the current trend persists, I plan to continue accumulating.

Bitcoin (BTC)
Whether or not you believe in BTC is irrelevant to this discussion. BTC has recently experienced a pullback, though this development is not unexpected. This is more apparent on the daily chart, which highlights its extended sideways consolidation period within the parallel channel. During this time, the RSI showed deteriorating signs, signaling weakness.
The breakdown occurred last week, with BTC hitting the 200-day moving average—typically considered a short-term buying signal by many, especially since the RSI also dipped into oversold territory. In the short term, I anticipate a retracement, or retesting, to the bottom of the parallel channel, around the $90K–$91K range.

Expanding to the weekly chart, we can clearly observe a bearish divergence that preceded this breakdown. While nothing is ever certain, the probabilities leaned toward this outcome. The upcoming retest will be crucial—if the price fails to break back above the bottom of the parallel channel, further downside is likely. The next common support zone appears to be in the $70K–$75K range in that case.
Of course, whether this scenario unfolds remains uncertain. However, as someone aiming to allocate a small portion of their portfolio to cryptocurrency, specifically BTC, this potential unraveling might present an entry point worth considering. The volatility remains elevated though, it is no safe haven like gold.

Dollarama (DOL)
As I’ve explained in my previous article on parallel channels, the upward trend initially broke down, shifted into a downward trend, and has now reversed to retest the bottom of the parallel channel formed at the end of 2023. The likely scenario is that the price will decline back to the green line (around the $130 range), where the next move will become clearer. If the price holds above this green line, it could signal the start of a new upward leg. However, if it breaks below and confirms, the outlook for DOL will become much less favorable.
With earnings set to be released in just over 30 days, the results are likely to determine the next leg for this stock. Additionally, the RSI showed a bearish divergence, which provided an early indicator of the potential pullback that we’ve witnessed.

Canadian National Railway (CNR)
Signs of a bullish divergence on the RSI, especially on the weekly chart, are certainly exciting. That said, this situation presents quite a dilemma. On one hand, the industrial sector could experience solid inflows due to market rotation. On the other hand, with the economy showing signs of slowing down and the uncertainty surrounding tariff threats, maintaining confidence in a reversal is challenging.
The key remains focusing on high-quality companies, ideally those with a strong competitive advantage or MOAT. This is the kind of reassurance investors seek for long-term confidence. Considering the ongoing bullish divergence, CNR might present a good buying opportunity at its current level—but exercising caution is still prudent.

Brookfield Corp. (BN)
BN has experienced an impressive rally, but it now seems to be losing momentum. Predicting how much higher it can climb remains uncertain, especially with the market still lacking signs of strength. However, one intriguing observation stands out during this upward trend—it pertains to the green trendline on the RSI. Historically, whenever the price has touched or approached this trendline, it has proven to be a favorable buying opportunity over the course of this run.
In my view, as long as this trendline remains intact, we might be entering a period of consolidation, during which buying at current levels could yield additional returns. That said, if the trendline breaks down and is confirmed, a significant pullback is likely to follow. What side do you choose?

Stantec (STN)
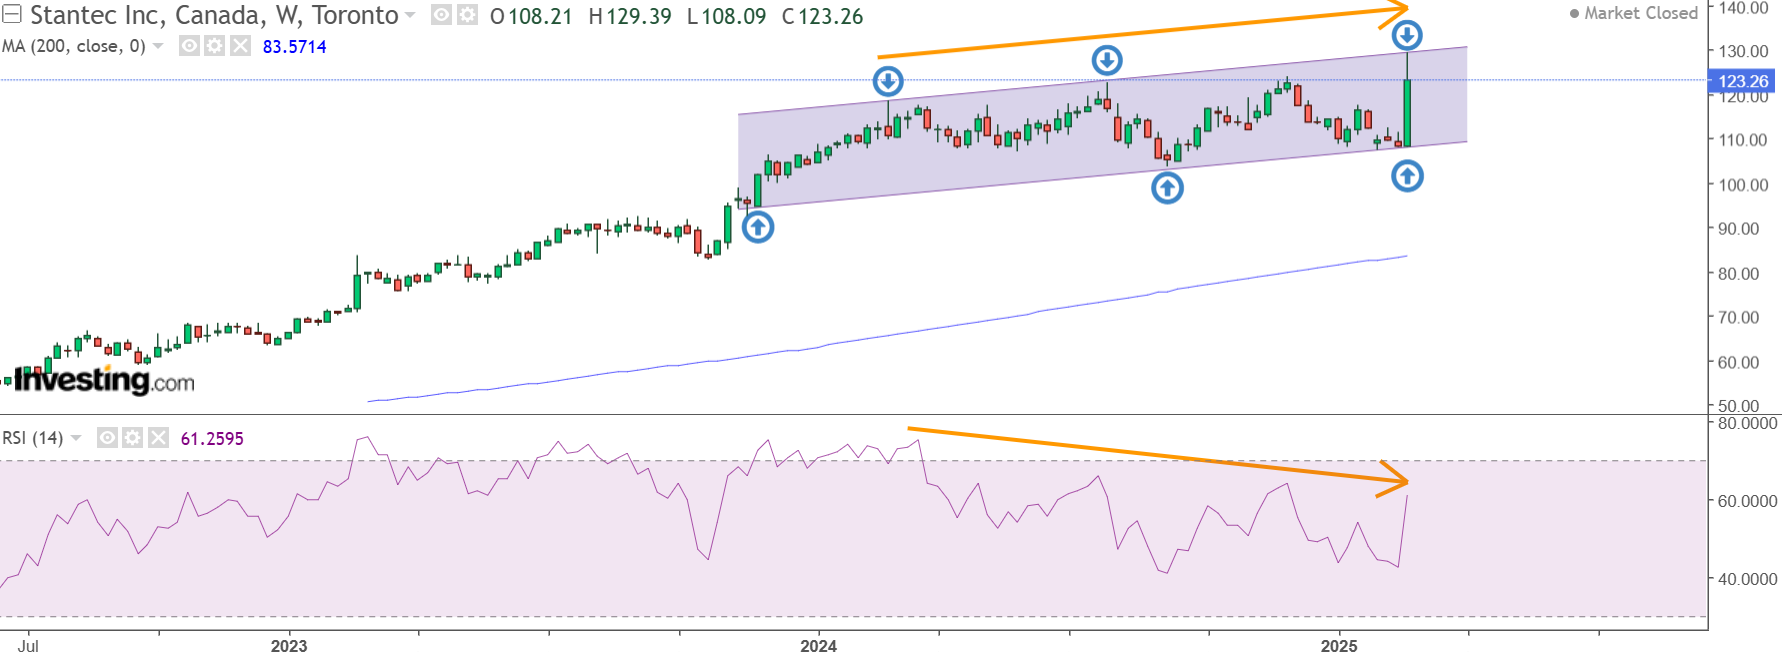
This is a high-quality company that I recently wrote about following its earnings call. Interestingly, the stock hit the bottom of its parallel channel just before the earnings announcement. However, the momentum post-call was so strong that it surged straight to the top of the channel within a single day. Since then, it has pulled back slightly. That said, the RSI divergence does not appear favorable, suggesting a potential bearish pattern. While this is a position I’m considering, I remain cautious due to this signal. If the stock revisits the bottom of the channel, I will reassess my stance.
Microsoft (MSFT)
It appears that most of the Mag 7 is experiencing a light pullback phase, likely due to concerns about overextension. Additionally, the market has reacted to news of reversed large capital expenditure commitments, fueling fears about future growth prospects.
MSFT finds itself in a challenging position. The stock is currently in a downward trend, yet it has shown strong support around $385, a level that has withstood multiple tests. If this support were to break, ~$350 could be the next target, which coincides with the 200-week moving average. Historically, this moving average has been a reliable indicator of excellent buying opportunities for high-quality companies. A broader view of the RSI trend may suggest potential for adding to one of the most successful compounders of the past decade. Notably, when the RSI reaches a certain lower threshold, it has historically marked good buying opportunities. GOOGL exhibits a similar pattern, and it might be worth exploring further if you're interested in conducting additional research.

Canadian Natural Resources (CNQ)

CNQ appears to be at a pivotal juncture in its trajectory. The stock has reached the bottom of its rising parallel channel, but it remains uncertain whether this is due to tariffs or the potential for a further decline in oil prices. If it manages to reverse its current downtrend, there is potential upside targeting the $60s. This is the essence of a risk-reward play.


Disclaimer
The content provided on this page by the publisher is not guaranteed to be accurate or comprehensive. All opinions and statements expressed herein are solely those of the author. Trading stocks can incur losses of the invested capital. Even all capital can be lost. This page represents my personal strategies, views, and decisions, which may not be appropriate for other investors. Please use common sense or consult with an investment professional before investing your money.

Consider joining DiviStock Chronicles’ Referral Program for more neat rewards!Please refer to the details of the referral program.