


June Charts Wrap-up
Insights and Patterns: A Monthly Dive into Stock Chart Analysis for the Average Investor

While my investing focus is often on fundamentals, there's a wealth of insight to be gained from simple stock chart patterns. In this monthly series of blog posts, I'll break down some straightforward yet perceptive chart patterns that can be identified in a select group of individual stocks. These patterns have been previously taught in earlier blog posts, which you can find at the end of this article. As always, exercise your own discretion and judgment when making financial decisions, as this is not investment advice.
S&P 500
May recap: Yes, we are still in a bullish market (…) At some point, a retest of line #1 is anticipated.

Bullish momentum continues as markets reach new all-time highs. When U.S. President Donald J. Trump (DJT) signals it's time to buy—history suggests it’s wise to pay attention.
Let’s revisit my earlier analysis from “The End Goal of Trump’s Tariffs.” I wrote the following, word for word:
Thirdly, Trump loves the stock market - the gauge of the US economy. Currently, the US stock market is at all-time highs. A short-term correction shouldn’t bother Trump too much considering other economies around the world are weak. Short-term pain is acceptable, but if it persists in the medium term, Trump will undoubtedly become more subtle and rethink his tariff approach. Escalating trade wars can lead to long-term pain so just keep this in mind. In fact, Trump wants to keep the USD as the world reserve currency. Therefore, trade needs to happen.

I will keep this simple through three images.

Image #1 - There are three inclining lines that are important for this index. The yellow line connects the top of the 2000 cycle before the dot-com burst to the more recent tops in the market. Let’s call it resistance. The blue line represents the top beginning before the great financial crisis in 2007 through the top in 2022. Let’s call it the midpoint. The red line connects all the bottoms since the pandemic in 2000. Let’s call it support.
📉 Crisis Mode We officially enter crisis territory if the red support line is broken. The tariff scare back in April brought us close, but the market held firm—an important signal that bullish sentiment remained intact.
🚀 Melt-Up Zone A break above the yellow resistance line marks the beginning of a melt-up phase. This would confirm that the current bullish momentum still has room to accelerate.
🔵 Midpoint Safety Zone The blue line represents our equilibrium. If the next pullback finds support here, it strengthens the case for continued upside. However, if it breaks below, caution is warranted as downside risks increase.

Image #2 - The weekly and monthly charts are already flashing bearish divergence signals, and the daily chart is on the verge of confirming the same. This suggests there may be a bit more upside left in the current move—evident in the narrow gap between the latest green candle and the resistance at the yellow line. However, momentum is clearly shifting. From a technical standpoint, a pullback is not just likely—it’s warranted.

Image #3 - This is speculative, but worth noting: what’s forming could be an inverse head and shoulders pattern—a bullish reversal setup. For those familiar with the classic head and shoulders, this is its mirror image. There’s a gap on the SPY1 chart between the $560–$580 range. If that gap fills and the price rebounds, it could complete the right shoulder of the pattern. Once the neckline (around the yellow line) is broken, the projected move upward typically mirrors the distance from the neckline down to the head. That implies a potential upside of nearly 30% from the breakout point.
🧠 What Is an Inverse Head and Shoulders Pattern? It’s a classic chart pattern that signals a potential trend reversal from bearish to bullish—in other words, it often shows up when a stock or index is about to stop falling and start rising.
📊 How It Looks Imagine a person shrugging:
Left Shoulder: The price drops, then bounces up.
Head: The price drops even lower, then bounces up again.
Right Shoulder: The price drops again, but not as low as the head, and then rises.
All three dips form a shape that looks like an upside-down head and shoulders.
Gold (GLD)
May recap: Gold has indeed retested the top of the parallel channel and appears to be consolidating in a bull flag. Currently, the USD is consolidating in a bearish flag pattern, mirroring gold’s movements inversely. If the dollar weakens further, gold prices are likely to surge.
🥇 Holding Strong at Support Gold continues to show resilience, holding above key support levels and consolidating in a bullish structure. As long as it remains outside the lower boundary of the parallel channel, the setup favors further upside. However, if gold re-enters the channel, a pullback toward the $3,000 level becomes a realistic scenario—potentially offering a compelling buying opportunity at that zone. The ongoing consolidation suggests strength, not weakness—especially given the broader macro backdrop. This remains a chart worth watching closely.

Gold and the U.S. dollar typically move in opposite directions, though this relationship isn’t absolute. When the dollar weakens, gold—priced in USD—becomes more affordable for foreign buyers, driving up demand and prices. Conversely, a stronger dollar makes gold more expensive globally, often leading to price declines.
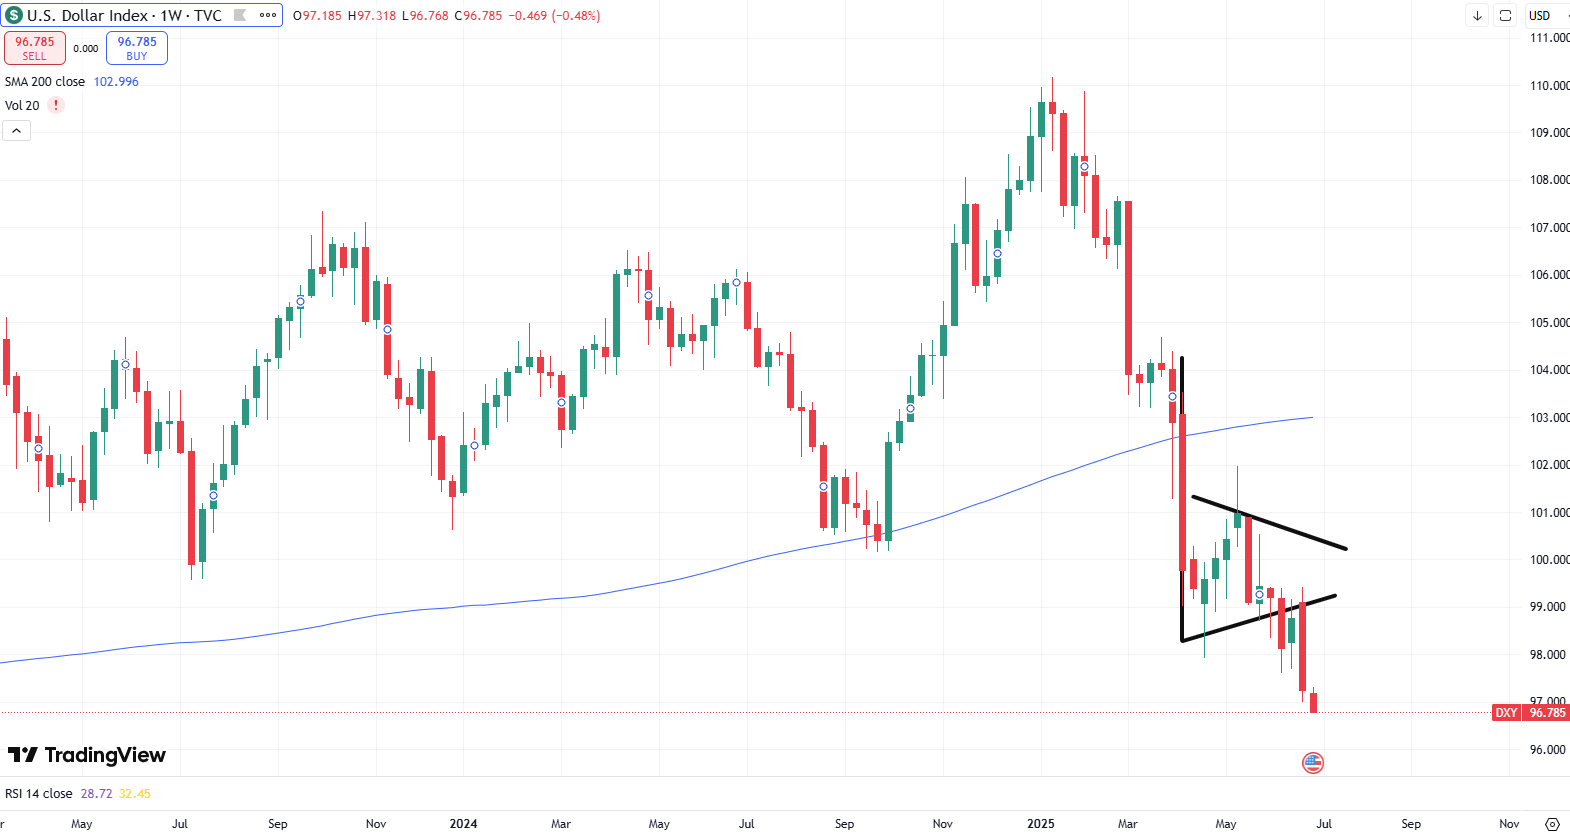
As previously anticipated, the bearish flag on the USD played out, seeing further breakdowns recently. Interestingly, while this didn’t give gold a major boost, gold held its ground—a subtle but important sign of strength.
While I believe there’s still room for more downside in the USD, it’s important to remember that the dollar often acts as a safe haven during times of crisis. When uncertainty rises, demand for the USD tends to surge. This renewed demand can reverse its decline, pushing the dollar higher again.
That’s the inflection point to watch: when the USD starts climbing steadily, it often signals that broader markets are about to turn sour. Historically, this pattern has repeated itself. I encourage you to look back at past recessions and study how the USD behaved before and after—there’s a lot to learn from those cycles. Pssst…The dollar is a key driver of almost every crisis over the last 25 to 30 years.
Bitcoin (BTC)
May recap: Another bearish divergence has emerged (orange arrow)—similar to the previous one (purple arrow) that led to a confirmed drop. Given this setup, some level of pullback seems likely, whether minor or more significant.
Let me emphasize this again—Bitcoin has not decoupled from traditional risk assets. It continues to move in lockstep with the Nasdaq, as represented by the QQQ ETF (purple). The chart patterns between Bitcoin and QQQ are nearly identical, with the key difference being volatility: Bitcoin’s price swings are simply more extreme in both directions.
When QQQ rallies, Bitcoin tends to follow. When QQQ pulls back, Bitcoin typically drops as well. Despite growing narratives around Bitcoin becoming a “digital safe haven,” the data tells a different story—the correlation remains strong and intact.

🔻 Bearish Divergence Still in Play As highlighted last month (see black arrows), the bearish divergence remains intact—and a pullback appears increasingly likely. That said, I’m watching this upcoming dip closely. If conditions align, it could present a strategic opportunity to add exposure ahead of what may be one final leg higher in this cycle.
Apple (AAPL)
🍏 AAPL at a Key Inflection Point Since rebounding from the tariff scare in April, AAPL has been consolidating around key support levels—and holding firm. The purple rectangular zone, marked as the loading area, has proven to be a critical support range. Buyers continue to defend this level, which is a strong sign of underlying strength.
Could this resilience be hinting at something bigger—perhaps an AI-related announcement or progress on a U.S.–China trade deal? Either way, AAPL is approaching an important inflection point, and how it behaves here could set the tone for its next major move.

Toromont Industries (TIH)
May recap: As I assess my portfolio in the coming weeks, TIH may become a new addition.
🏗️ Watching TIH for a Strategic Entry I’m still holding off on deploying funds into a new position in TIH, but it’s firmly on my radar. As with any investment, there’s a clear plan in place. Much like the S&P 500 setup discussed earlier, TIH appears to be forming a potential inverse head and shoulders pattern. The bearish RSI divergence supports the case for a near-term pullback.
If that pullback materializes, I’ll be looking to enter near the bottom of the right shoulder, anticipating a rebound toward the top of the ascending parallel channel—a trend TIH has respected since 2021. The long-term structure resembles a coiled spring, gradually building pressure. It’s a setup that’s both technically compelling and fundamentally supported. Fingers crossed.

Microsoft (MSFT)
May recap: While a retest may occur, this breakout opens the door for MSFT to challenge its all-time high and potentially push into the $500 range.
📈 Trendlines Don’t Lie Simple trendlines continue to prove their value—the $500 level was indeed reached. While there may still be a bit more upside toward $510, the technical indicators are flashing warning signs. The asset is deeply overbought across multiple timeframes, suggesting that a pullback is not only likely but overdue.

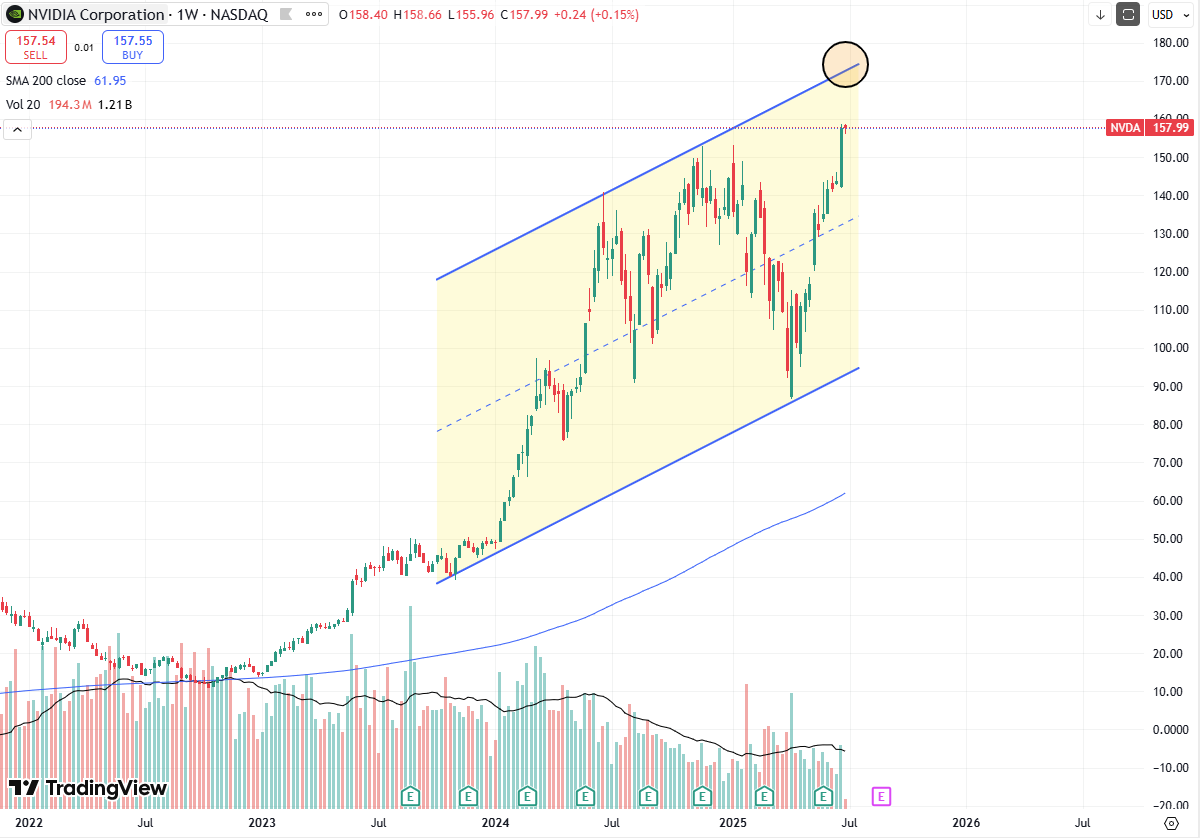
Nvidia (NVDA)
When it comes to NVDA, it’s a question of when, not if, the AI boom loses steam. As major tech players begin to see diminishing returns on their aggressive AI investments, a strategic pullback seems inevitable. Meanwhile, competition is heating up—especially from AMD—which is likely to drive down GPU prices.
While I don't personally hold NVDA, I track it closely given its significant weight in the broader U.S. index. In my view, tech giants are likely to respond in one or both of the following ways:
Pivot to more affordable chips in the short term, while ramping up in-house chip development efforts;
Acquire promising startups to stay competitive—because burning time (and cash) on inefficient AI ventures is no longer sustainable.
This may take some time, but it is the end result, just like in the dot-com bubble. And do not forget this loophole that I have discussed in the past. However, this takes a lot of time to unravel.
NVIDIA's Chip Ban Loophole?

Is NVIDIA (NVDA) hiding certain things through financial or accounting manipulation? Did NVDA actually find a loophole to propel sales into China? This editorial will delve into these questions, drawing on the extract from NVDA’s latest earnings report.
On a technical basis, there is still room for a top within this parallel channel to the $170’s.


Disclaimer
The content provided on this page by the publisher is not guaranteed to be accurate or comprehensive. All opinions and statements expressed herein are solely those of the author. Trading stocks can incur losses of the invested capital. Even all capital can be lost. This page represents my personal strategies, views, and decisions, which may not be appropriate for other investors. Please use common sense or consult with an investment professional before investing your money.

Consider joining DiviStock Chronicles’ Referral Program for more neat rewards!Please refer to the details of the referral program.SPY is an ETF that tracks the S&P 500 Index, which includes 500 of the largest publicly traded companies in the U.S.