


Royal Bank - The Cream of the Crop - FY24
As companies start to reveal their earnings for the fiscal year 2024, here are the results for a stock in my portfolio along with a business valuation.

Welcome to my summary of Royal Bank’s ($RY) earnings report for fiscal 2024. For additional context, please refer to my earlier post detailing my valuation methodology.

Year-End Results
It is undeniable that Royal Bank (RY) stands as a titan among banks in Canada. The successful integration of HSBC has paid off, and it is now enjoying the benefits. But a fair warning is being sent out in regard to the Canadian economy.
Revenues increased by 11%.
Earnings per share (EPS) experienced a 9% increase, while the adjusted EPS also rose by 8%.
Dividends per share (DPS) increased by 5%, a smaller increase than previous years.
The payout ratio remained around 50%, which is in line with the company's target range of 40%-50%.
The net interest margin1 has keeps improving since the pandemic and pushes to around 1.54%.
The net profit margin remained steady around 28%.
The loan-to-deposit ratio (LDR2) remains around 70%, which is considered very healthy for a bank.
Provision for credit losses (PCLs3) have increased from $2.4 billion to $3.2 billion.
The annualized average growth rate of the share price was +7% over five years, +6% over three years, and +11% over the past year.
The number of outstanding shares has marginally risen, yet it still falls short of the pre-pandemic figures.
Investor Call Highlights
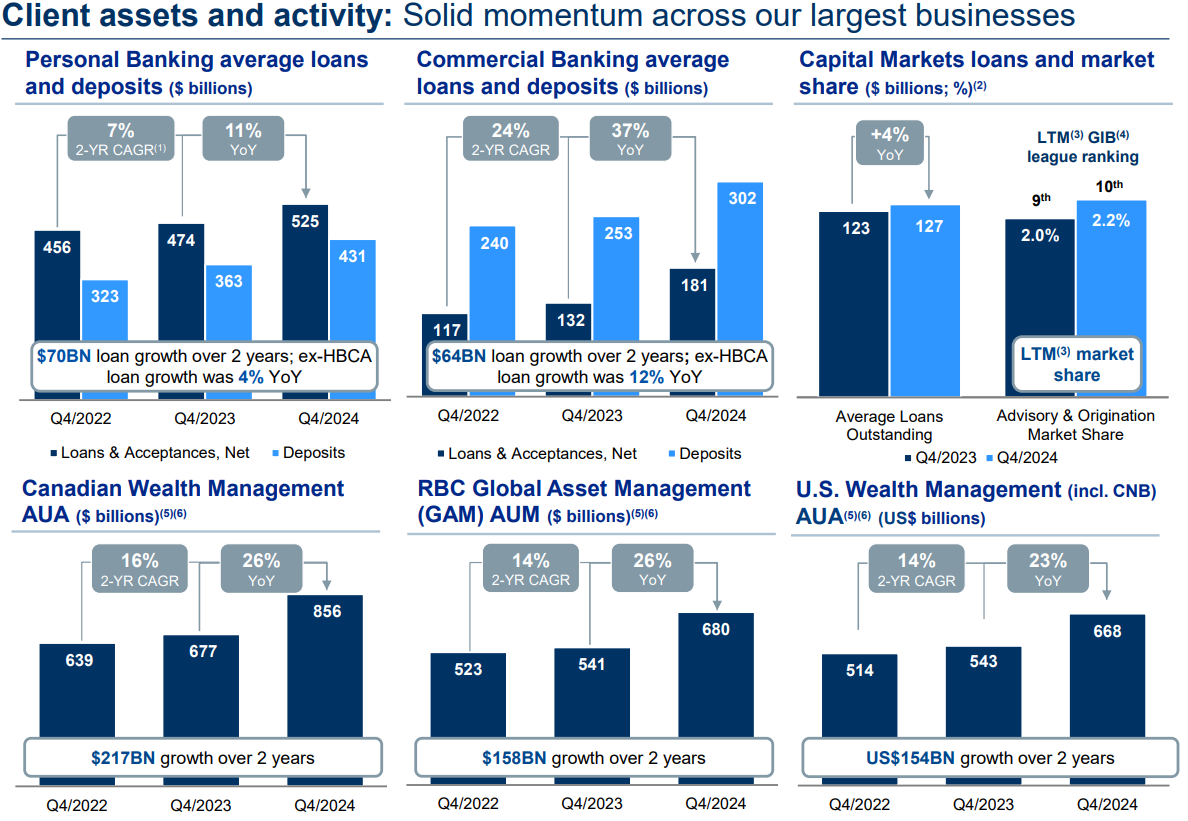
Growth Everywhere. Observe the slide below. It shows consistent year-over-year growth. This illustrates the extensive reach of RY in personal and commercial banking, capital markets, and wealth and asset management.
HSBC Synergies. RY is progressing ahead of schedule and realizing synergies more quickly than anticipated. With a significant portion of these expected to materialize in 2025, RY is poised for a strong year, provided there are no concerns about a recession unraveling. This acquisition has significantly increased RBC's scale, particularly in commercial banking.

Canadian Residential Mortgages. Similar to the Bank of Nova Scotia, Canada's mortgage portfolio maintains a balanced composition with 70% fixed and 30% variable. Like all Canadian banks, there is a significant wave of maturities expected between 2025 and 2027. The image below effectively summarizes RY's mortgage portfolio. Provided that interest rates decrease, there should be minimal concern for this bank. However, the devaluation of the Canadian dollar, escalating inflation, and a shift in sentiment towards rising interest rates could pose issues.
In 2020, the average 5-year fixed mortgage rate in Canada was around 2.79%
In 2021, the average 5-year fixed mortgage rate in Canada was around 2.15%
In 2022, the average 5-year fixed mortgage rate in Canada was around 3.40%
Based on the latest forecasts, here are the expected average 5-year fixed mortgage rates in Canada for the upcoming years:
2025: Around 4.11%.
2026: Approximately 4.14%.
2027: Expected to be around 4.18%.

The Bigger Concern. Provisions for credit losses (PCLs) on impaired loans have seen an upward trend within Canadian Banking. Notably, this increase did not originate from residential mortgages but was due to impacts in specific sectors such as Automotive, Industrial, and Consumer Discretionary, and even office commercial real estate.

Consequently, a warning has been issued regarding the Canadian economy.

My Own Valuation
There is a genuine reason why RY commands a significant premium over other Canadian banks. It has consistently outperformed its peers and remains a favorite among many investors.
As a satisfied shareholder of RY, I have not found an opportune moment to increase my holdings due to its substantial rise this year. Its P/E ratio is much higher than its historical averages, and its market price to book value remains elevated.

As previously mentioned, the Canadian economy is not as strong as some may believe, facing several challenges that need to be addressed. It's also worth noting that the dividend increase for RY was not as significant as in previous years, which was a measure taken to maintain the payout ratio within its targeted range. Despite this, RY maintains its position as the strongest bank, making it my top pick to invest in should there be any downturn in the financial sector.

Banks stand to gain as interest rates decrease and monetary expansion continues. Nevertheless, it is prudent to lock in profits prior to a possible crisis. It is noteworthy that Canadian banks are typically regarded as more secure than their American counterparts. However, as the call iterated, it was noted that the Canadian economy is in a more precarious state than that of our southern neighbours as we approach 2025.
Net Income Growth: The spreadsheet presents a growth estimate that reflects the company's anticipated rise in net income for the upcoming five years, based on the average of projections from multiple analysts. The estimate is additionally adjusted down to reflect a more conservative approach.
Free Cash Flow to Equity (FCFE): This is calculated for several years, showing the amount of cash that could be distributed to shareholders after all expenses, reinvestment, and debt repayments.
Discounted Cash Flow (DCF) Valuation: The spreadsheet includes a DCF valuation section, which is a method used to estimate the value of an investment based on its expected future cash flows. It provides two valuation methods:
Perpetuity Growth: Calculated using a long-term growth rate and discounting future cash flows.
Exit Multiple: Based on an exit price-to-earnings (P/E) multiple.
Current Share Price vs. DCF Value: A table compares the current share price of ATD with the estimated share price based on DCF valuation, suggesting whether the stock is undervalued or overvalued according to the model.
Disclaimer: The information provided in this valuation analysis is for educational and informational purposes only. It does not constitute financial advice or a recommendation to buy, sell, or hold any specific stocks or securities. The valuation model presented here relies on certain assumptions, including projected future cash flows and discount rates.
Other FY24 Reviews


Net Interest Margin (NIM): Measures the difference between the interest income generated and the amount of interest paid out to lenders, relative to the amount of their interest-earning assets. A good NIM for banks typically falls around 3% to 4%
LDR: Measures the proportion of a bank's total loans to its total deposits. It indicates how much of the bank's deposits are being used to fund loans. The ideal LDR typically falls between 80% and 90%.
Provision for Credit Losses (PCLs): Funds that financial institutions set aside to cover potential losses from loans and other credit exposures that may not be repaid. PCLs are treated as an expense on the company's financial statements which reduces a company’s earnings.