


Pepsi - Fizzes Out - FY24
As companies start to reveal their earnings for the fiscal year 2024, here are the results for a stock on my watchlist along with a business valuation.

Welcome to my summary of Pepsi’s ($PEP) earnings report for fiscal 2024. For additional context, please refer to my earlier post detailing my valuation methodology.

Year-End Results
PepsiCo's performance in 2024 was underwhelming. The stock price was affected by Robert F. Kennedy Jr.'s appointment as United States Secretary of Health and Human Services, with his goal of making America healthy again. However, PepsiCo's performance did not alleviate these concerns.
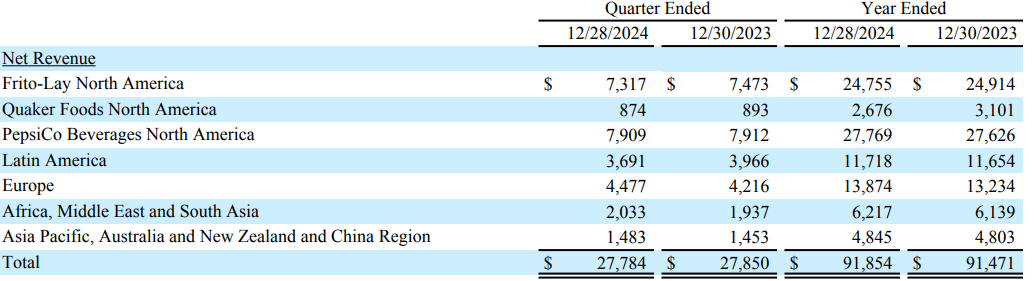
Revenues increased by less than 1%.
Earnings per share (EPS) experienced a 6% increase, while the adjusted EPS increased by 7%.
Dividends per share (DPS) increased by 8%.
The payout ratio close around 77%, which is about the historical average for the past five years.
Operating cash flow (OCF) was $12.5 billion, and free cash flow1 (FCF) was approximately $7.2 billion.
The net profit margin remained around 10.5%.
The long-term debt-to-equity ratio has remained elevated at 2.06 with a FCF to Debt of 0.16. This is not uncommon.
The annualized average growth rate of the share price was +5% over five years, +3% over three years, and -5% over the past year.
The number of outstanding shares is materially unchanged.
Investor Call Highlights
Headwinds. The company expects a foreign exchange translation headwind of approximately 3% to negatively impact reported net revenue and core EPS growth. PEP also anticipates higher net interest expenses due to rolling over debt at slightly higher rates and higher debt balances from recent acquisitions. Increased pension expenses also noted.
International Growth. While North American growth in the snacks and beverages category is a bit muted, international growth has been a significant growth driver, contributing nearly $40 billion to its overall revenue. However, with weaker currencies globally against a strong US dollar, this has not helped. Currency declines against the U.S. dollar which are not offset could adversely impact PEP’s future financial results.

Health vs. Value. Value is the primary decision factor for PepsiCo's (PEP) consumers. Although health is becoming more of a priority, PepsiCo focuses on stronger pricing, sizing, and promotional activities that yield high ROI and maximize category value. However, PepsiCo remains committed to product reformulation, innovation, and promoting healthier options.
My Own Valuation
Inflation often benefits companies like these, as they can capitalize on rising prices. However, once inflation moderates to a reasonable level, the focus shifts to gaining more market share, which PepsiCo has been struggling with due to intense competition. Despite their diversified portfolio of goods, numerous alternatives exist. This might be why Coca-Cola isn’t as diverse in their product offerings, recognizing the fierce competitive environment.

Growth estimates have decreased significantly compared to the previous year. This decline supports the recent drop in PepsiCo's (PEP) stock price, but does it truly justify it? In one of my previous posts (see link below), I mentioned how PEP's price seemed attractive for the long-term. Whether or not you're considering an investment in the consumer discretionary sector, this might be worth looking into.


Net Income Growth: The spreadsheet presents a growth estimate that reflects the company's anticipated rise in net income for the upcoming five years, based on the average of projections from multiple analysts. The estimate is additionally adjusted down to reflect a more conservative approach.
Free Cash Flow to Equity (FCFE): This is calculated for several years, showing the amount of cash that could be distributed to shareholders after all expenses, reinvestment, and debt repayments.
Discounted Cash Flow (DCF) Valuation: The spreadsheet includes a DCF valuation section, which is a method used to estimate the value of an investment based on its expected future cash flows. It provides two valuation methods:
Perpetuity Growth: Calculated using a long-term growth rate and discounting future cash flows.
Exit Multiple: Based on an exit price-to-earnings (P/E) multiple.
Current Share Price vs. DCF Value: A table compares the current share price of ATD with the estimated share price based on DCF valuation, suggesting whether the stock is undervalued or overvalued according to the model.
Disclaimer: The information provided in this valuation analysis is for educational and informational purposes only. It does not constitute financial advice or a recommendation to buy, sell, or hold any specific stocks or securities. The valuation model presented here relies on certain assumptions, including projected future cash flows and discount rates.
Other FY24 Reviews


Consider joining DiviStock Chronicles’ Referral Program for more neat rewards!Please refer to the details of the referral program.