


This Month in Earnings - FY24 - February (Part 1)
Earnings Reviews include Waste Connections, Intact Financial, Toromont Industries, Canadian Tire, Telus, and CT REIT.

Welcome to my summary of earnings reports for fiscal 2024. As companies start to reveal their earnings for the fiscal year 2024, here are the results for stocks on my watch along with a business valuation. For additional context, please refer to my earlier post detailing my valuation methodology.

Waste Connections (WCN)
Year-End ResultsRevenues increased by 11%.
Earnings per share (EPS) decreased by 19%; however, the adjusted EPS increased by 14%.
Dividends per share (DPS) increased by 11%.
The payout ratio rose to 49% but remains healthy.
Operating cash flow (OCF) totaled $2.2 billion, and free cash flow1 (FCF) amounted to $1.2 billion. Excellent cash flow management!
The net profit margin dropped to 6.9%.
The long-term debt-to-equity ratio keeps increasing, now at 1.06, with a FCF to Debt of 0.14.
The annualized average growth rate of the share price was +15% over five years, +16% over three years, and +28% over the past year.
The number of outstanding shares remain largely unchanged.
Summary HighlightsAcquisitions: Waste Connections had a record year in 2024 with $750 million in annualized revenue from 24 acquisitions. Continued strong acquisition activity is expected to contribute to high-end growth in 2025.
Employee Engagement: Multi-year lows in employee turnover. Significant improvements in employee engagement and retention, with voluntary turnover declining by 50% over two years.
Balance Sheet: Year-end leverage of less than 2.7 times, allowing for potential acquisition activities and investments in sustainability.
Market Trends: The waste management industry is expected to grow due to advancements in waste management technologies, development of new policies, and the growing need for robust waste management frameworks to improve air and water quality, reduce greenhouse gas emissions, and reduce energy consumption.
Chiquita Canyon Liabilities: Significant financial impacts due to the closure of Chiquita Canyon, including $116.1 million in site costs and $480.8 million in closure and post-closure liabilities.
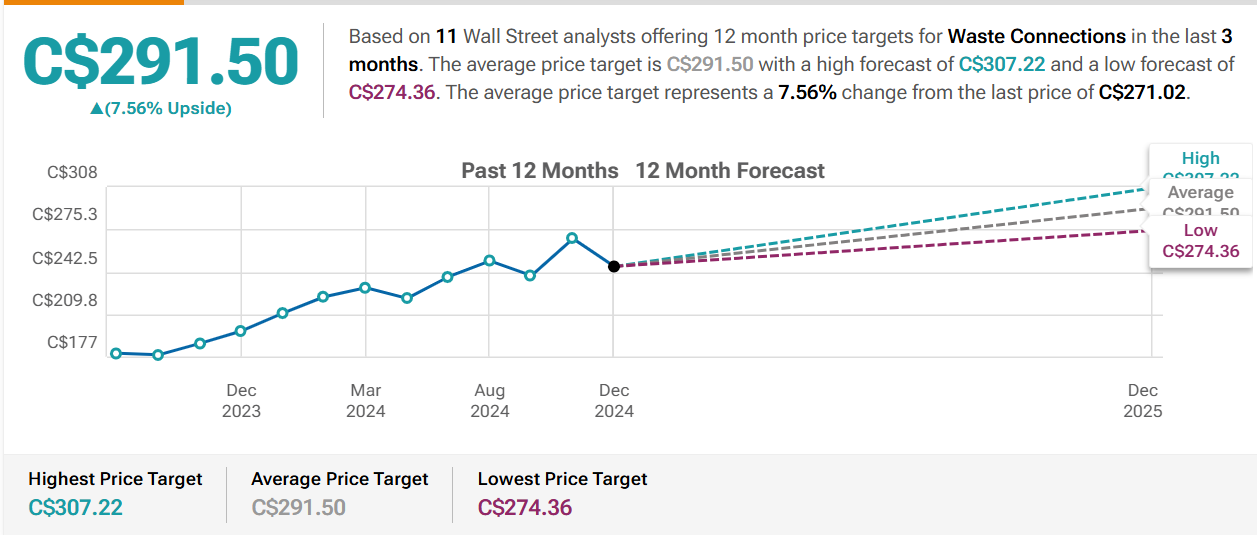
My Own ValuationWaste Connections (WCN) provides non-hazardous waste collection, transfer, disposal services, and resource recovery in the US and Canada. For the average investor, garbage is good. This company is one of those that you cannot avoid in society. Their ability to set their own pricing for services is also strong. This is why it has always traded at such a high premium—you rarely get a good opportunity to buy in.
One area to monitor is their growing debt as they continue to leverage resources to acquire more revenue-generating assets. As long as these acquisitions provide synergies and continue to generate a healthy return on investment, WCN should fare well over the coming years.
Intact Financial (IFC)
Year-End ResultsRevenues increased by 5%.
Earnings per share (EPS) increased by 77%. On a more normalized basis, the adjusted EPS increased by 58%.
Dividends per share (DPS) increased by 10%, marking the 20th consecutive annual increase.
The payout ratio was kept at a healthy percentage of 39%.
Operating cash flow (OCF) totaled $3.4 billion, and free cash flow1 (FCF) amounted to $2.9 billion. This has been consistent in recent years.
The net profit margin remains around its average of 8%.
The long-term debt-to-equity ratio remains strong around 0.29, with a FCF to Debt of 0.55.
The annualized average growth rate of the share price was +14% over five years, +14% over three years, and +20% over the past year.
The number of outstanding shares remain largely unchanged.
Summary HighlightsShare Buyback: The share buyback program has been renewed, providing flexibility in capital deployment.
Capital and Investment: Total capital margin stands at $2.9 billion, with strong capital generation.
Catastrophe Losses: In 2024, CATs added up to $1.5 billion due to severe weather events, including torrential rains in Southern Ontario, wildfires in Jasper, a hailstorm in Calgary, and flooding in Québec. Looking ahead to 2025, we are increasing our annual CAT guidance to $1.2 billion. This reflects our growing premium base, inflation and recent experience.
My Own ValuationThe fact that IFC still managed to generate substantial capital despite significant catastrophe losses is remarkable. They are arguably the best insurance business I've seen in terms of growth. While you might dislike insurance companies for consistently increasing premiums on their consumers each year, investing in them could be a way to offset that financial impact.
If the market continues its upward trend, IFC will likely keep growing. The expected growth rates are high but can be achieved especially now that they have launched a buyback program. However, if there's a healthy correction, this might be an opportune time to invest with my cash position. It's always good to have such companies in your back pocket for when the market dips.


Toromont Industries (TIH)
Year-End ResultsRevenues increased by 9%.
Earnings per share (EPS) decreased by 5%.
Dividends per share (DPS) increased by 12%.
The payout ratio was kept at a healthy percentage of 31%. This is in the company’s target range of 30-40%.
Operating cash flow (OCF) totaled $359 million, and free cash flow1 (FCF) amounted to $223 million.
The net profit margin remains around its average of 10%.
The long-term debt-to-equity ratio keeps getting better reducing to 0.18, with a FCF to Debt of 0.32.
The annualized average growth rate of the share price was +14% over five years, +6% over three years, and +12% over the past year.
The number of outstanding shares remain largely unchanged.
Summary HighlightsKey Ratios: Super strong performance across the board.
→ Gross profit margin: 25.1%
→ Operating income margin: 13.3%
→ Return on capital employed: 25.7%
→ Return on equity: 19.2%
Challenges in the Near Term: Construction and mining industry challenges are the main ones. These may consist of labour shortages, volatile material prices, rising exploration costs, government involvement, etc.
Inventory Levels: Investment in non-cash working capital increased 32% versus a year ago. This increase was mainly driven by higher inventory levels reflective of the higher new equipment sales levels, improved product availability, and normalizing supply conditions.
Tariff Concerns: Foreign exchange, rate volatility and a weaker Canadian dollar are also being monitored given the majority of our supply equipment supply of equipment and parts is sourced in U.S. dollars. Hedging practices and policies will continue to be used to manage the bottom-line exposure to changing exchange rates.
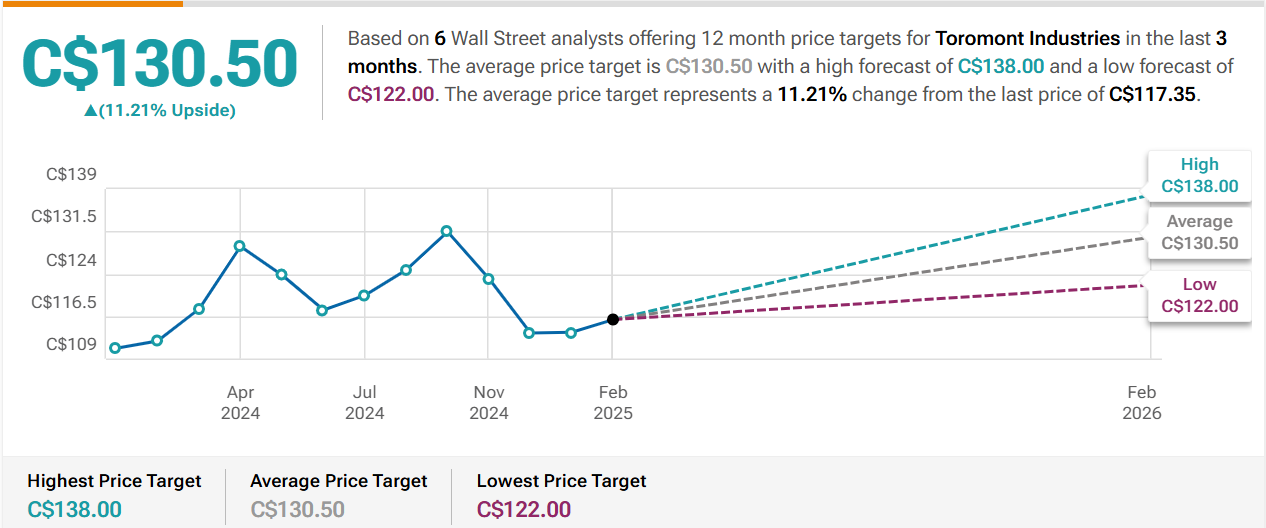
My Own ValuationToromont Industries is a leading provider of industrial equipment, including the sale, rental, and servicing of machinery for various industries such as construction, mining, and forestry.
A market downturn would certainly impact this company significantly. However, on the bright side, it has the financial strength to handle a recovery well. If you're considering an industrial play, TIH is worth looking at or keeping in your back pocket for when a correction occurs. Remember, this industry is highly cyclical, so be prepared for potential volatility.

Canadian Tire (CTC.A)
Year-End ResultsRevenues decreased by 2%.
Earnings per share (EPS) increased by 321%. On a normalized basis, adjusted EPS increased by 22%.
Dividends per share (DPS) increased by 1%.
The payout ratio is being managed and fell to 56%. This is in an attempt to get back to the company’s target range of 30-40%.
Operating cash flow (OCF) totaled $2.0 billion, and free cash flow1 (FCF) amounted to $1.4 billion.
The net profit margin landed around 6%.
The long-term debt-to-equity ratio keeps improving, slowly, to 1.35, with a FCF to Debt of 0.13.
The annualized average growth rate of the share price was 0% over five years, -3% over three years, and -10% over the past year.
The number of outstanding shares remain largely unchanged.
Summary HighlightsDiverse Products and Services: The company continued to show strong results in essential categories, led by the Automotive division. This is in light of consolidated retail and comparable sales, excluding Petroleum, being down 1.7%.
→ Mark's, the apparel sector of Canadian Tire, showed considerable returns and is set to open more stores in 2025.
→ Automotive categories, particularly auto parts, auto maintenance, and tires, drove growth.
Triangle Rewards Program: Experienced growth, with more members joining and spending more.
Margin Management: Although revenues hardly increased, earnings per share exploded versus the prior year on a basic and normalized basis. Efforts to reduce supply chain costs contributed to lower operating expenses. Investments in the ONE digital platform and AI tools enhanced efficiency and performance.
Tariff Concerns: CTC's CEO, Greg Hicks, expressed concern about the potential impact of tariffs on the company's operations and the broader economy. He mentioned that the threat of tariffs has likely erased the recent uptick in consumer confidence. The company is reviewing its product sourcing and U.S. suppliers to mitigate the potential inflationary pressure these tariffs could bring. Hicks also highlighted the importance of finding Canadian suppliers and exploring alternatives to U.S. products., which made up about 15% of CTC’s goods.
My Own ValuationTariffs! Every headline following CTC's full-year 2024 earnings release focused on this topic. Perhaps their conference call caused more concern than anticipated, leading to a stock drop of over 7%.
Again, only 15% of goods were sourced from the U.S. And of that 15%, 25-30% is able to be facilitated to other alternatives within Canada. Don’t undermine CTC’s supply chain management.
Consider this: if the tariffs don't materialize, it could be a significant tailwind for CTC. Understandably, the stock has been in a downtrend since its all-time highs, but it's now back to pre-pandemic levels. For the long term, this could be a great opportunity, albeit with some risk. Regardless, note how management delivered an upbeat performance despite minimal revenue growth. Their cost management skills were evident in the bottom line, showing they're looking out for shareholders through diligent monitoring.


Telus (T)
Year-End ResultsRevenues increased by 1%.
Earnings per share (EPS) increased by 16%. On a normalized basis, adjusted EPS increased by 9%.
Dividends per share (DPS) increased by 7%.
The payout ratio is at 117%. Under Telus’ method, it stands at 81%. This is slightly improved from prior years. The target range remains between 60-75%.
Operating cash flow (OCF) totaled $4.8 billion, and free cash flow1 (FCF) amounted to $2.0 billion.
The net profit margin landed around 4.7%.
The long-term debt-to-equity ratio keeps expanding, up to 1.64, but FCF to Debt remains stable at 0.07.
The annualized average growth rate of the share price was -2% over five years, -7% over three years, and -12% over the past year.
The number of outstanding shares slightly increased.
Summary HighlightsHealth and Agriculture: After struggles in these areas, TELUS Health saw a 10% revenue increase and TELUS Agriculture & Consumer Goods experienced a 16% rise in revenue, emphasizing the growth in these sectors.
Customer Growth: TELUS saw a significant increase in customers with 328,000 new Mobile and Fixed customer additions in Q4 2024. This includes 70,000 mobile phone additions, 194,000 connected devices, and 64,000 Fixed customer additions.
→ TELUS reported significant customer growth, with over 1,200,000 net new telecom customer additions in all of 2024.
Debt and Financial Strategy: The company plans to reduce its capital expenditures and focus on cost efficiency.
→ Telus plans to achieve a net debt to EBITDA ratio of approximately three times by 2027. The company intends to reduce the discount associated with the DRIP in 2026 and fully remove it in 2027. This move is aimed at supporting their deleveraging efforts and improving their financial stability
No More Large Capex: After almost a decade of heavy investment in the Canadian market, Telus management now sees any continuation of this largely behind them given the pervasiveness of their network build.
My Own ValuationThe key difference between Telus and its closest competitor, Bell, is Telus' commitment to reducing debt levels. Telus management is focused on strengthening their balance sheet, whereas Bell continues to invest heavily in highly competitive market areas.
This strategic approach is one of the reasons I'm choosing to keep Telus in my portfolio. I recently sold my Bell shares for reasons detailed below. Additionally, Telus' growth vectors in Telus Health have shown a strong recovery, providing a unique avenue for business expansion. The dividend talk is a bit interesting, though they do so with good intentions of making their primary goal to reduce debt to ensure shareholder value through share price accretion. Keep an eye out for their new dividend plan in May.


CT REIT (CRT.UN)
Year-End ResultsRevenues increased by 5%.
Funds from Operations (FFO) increased by 3%.
Dividends per share (DPS) increased by 3%.
The payout ratio based on FFO remained steady at 74%. Very healthy.
Operating cash flow (OCF) totaled $436 million, and free cash flow (FCF), or in other terms - adjusted funds from operations (AFFO), amounted to $292 million.
The net profit margin landed around 6%.
The long-term debt-to-equity ratio was 0.73, with a AFFO to Debt of 0.22.
The annualized average growth rate of the share price was 0% over five years, -5% over three years, and -4% over the past year.
The number of outstanding shares remain largely unchanged.
Summary HighlightsFinancially Sound: CT REIT maintained a conservative balance sheet with leverage and coverage ratios at the lower end of the peer group. High occupancy rate of 99.4%, indicating a strong portfolio.
Canadian Tire Weighting: The development pipeline for CT REIT is probably 80% of Canadian Tire projects. A risky proposition to be over levered in a single tenant, but there is plenty of history to say Canadian Tire is a staple in Canada.
→ Canadian Tire represents 92.8% of total gross leasable area (GLA) and 91.7% of annualized base minimum rent.
Safety: The weighted average lease term for CT REIT’s portfolio was 7.7 years, which remains one of the longest in the sector.
My Own ValuationCRT.UN is one of the strongest REITs in Canada, making it an attractive option for income investors. However, as a long-term investor, I have concerns about its heavy reliance on a single tenant, Canadian Tire. Any negative impact on Canadian Tire could significantly affect this REIT. While the lack of tenant diversity is a drawback, Canadian Tire has a strong presence in Canada's retail landscape and is likely to continue thriving for years to come. The yield is particularly appealing for those in retirement or approaching it.


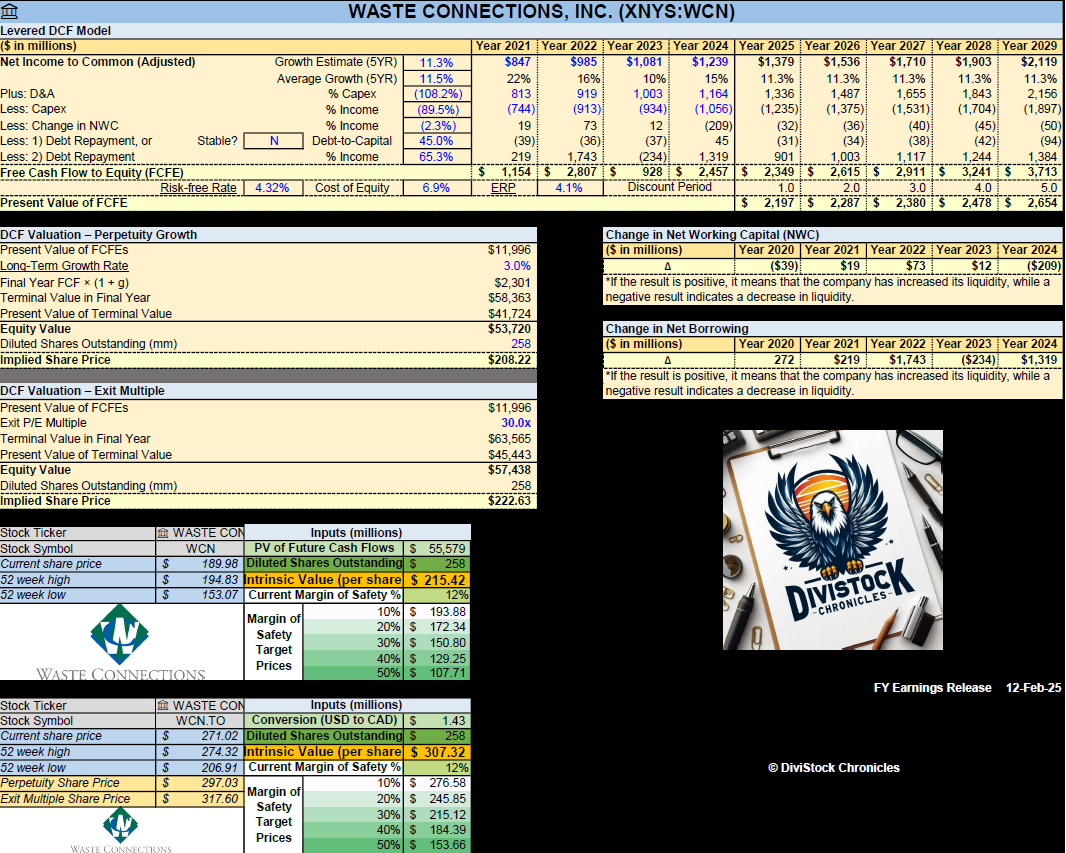
Net Income Growth: The spreadsheet presents a growth estimate that reflects the company's anticipated rise in net income for the upcoming five years, based on the average of projections from multiple analysts. The estimate is additionally adjusted down to reflect a more conservative approach.
Free Cash Flow to Equity (FCFE): This is calculated for several years, showing the amount of cash that could be distributed to shareholders after all expenses, reinvestment, and debt repayments.
Discounted Cash Flow (DCF) Valuation: The spreadsheet includes a DCF valuation section, which is a method used to estimate the value of an investment based on its expected future cash flows. It provides two valuation methods:
Perpetuity Growth: Calculated using a long-term growth rate and discounting future cash flows.
Exit Multiple: Based on an exit price-to-earnings (P/E) multiple, or price-to-FCFE multiple.
Current Share Price vs. DCF Value: A table compares the current share price of ATD with the estimated share price based on DCF valuation, suggesting whether the stock is undervalued or overvalued according to the model.
Disclaimer: The information provided in this valuation analysis is for educational and informational purposes only. It does not constitute financial advice or a recommendation to buy, sell, or hold any specific stocks or securities. The valuation model presented here relies on certain assumptions, including projected future cash flows and discount rates.
Other FY24 Reviews


Consider joining DiviStock Chronicles’ Referral Program for more neat rewards!Please refer to the details of the referral program.
Thank you for sharing this! Some real knowledge here.