


This Month in Earnings - FY24 - February (Part 2)
Earnings Reviews include Magna International, TC Energy, Enbridge, Fortis, and CAPREIT.

Welcome to my summary of earnings reports for fiscal 2024. As companies start to reveal their earnings for the fiscal year 2024, here are the results for stocks on my watch along with a business valuation. For additional context, please refer to my earlier post detailing my valuation methodology.

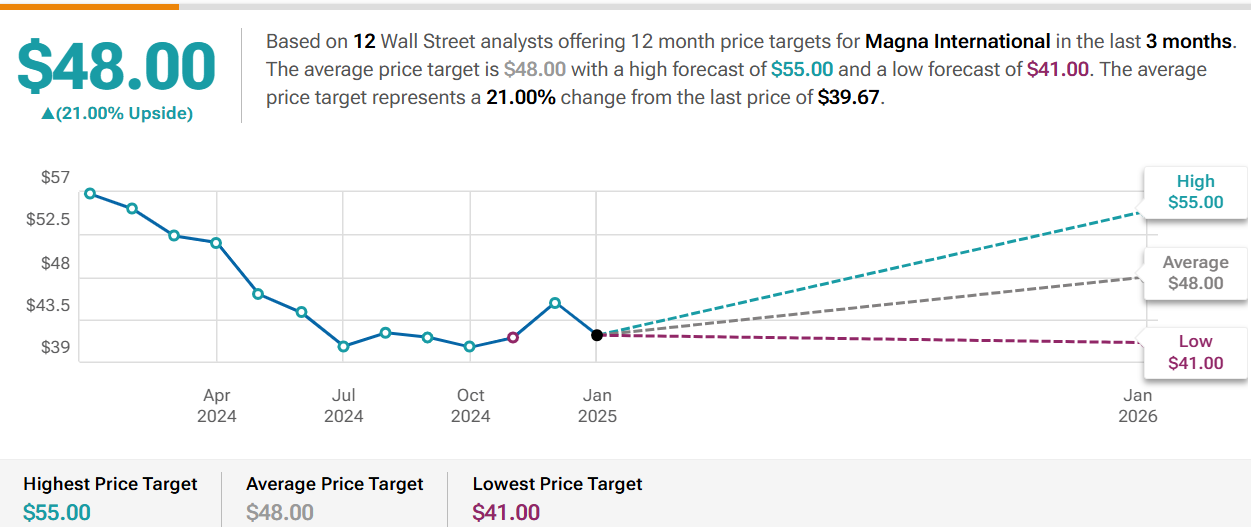
Magna International (MG)
Year-End ResultsRevenues increased just by a smidge of less than 1%.
Earnings per share (EPS) decreased by 17%; while, the adjusted EPS decreased by 1%.
Dividends per share (DPS) increased by 3%.
The payout ratio rose to 54% but remains healthy.
Operating cash flow (OCF) totaled $3.6 billion, and free cash flow1 (FCF) amounted to $1.4 billion. Improvements noted!
The net profit margin continues to struggle around 2.4%.
The long-term debt-to-equity ratio is at 0.50, with a FCF to Debt of 0.21.
The annualized average growth rate of the share price was -1% over five years, -16% over three years, and -15% over the past year.
The number of outstanding shares remain largely unchanged.
Summary HighlightsOperational Excellence: Successful margin expansion and increased cash flow generation through operational excellence, restructuring, reduced capital spending, and commercial recoveries.
Industry Headwinds: Achieved results despite lower vehicle volumes in key markets and other industry challenges. However, saw a 15% sales growth in China.
Key Assumptions for 2025:
→ Automotive light vehicle production is expected to decline in North America and Europe but remain stable overall.
→ Lower net engineering spend and benefits from restructuring actions are expected to contribute positively.
EV Market Volatility: The electric vehicle (EV) market has seen significant pullbacks and recalibrations, leading to commercial settlements and adjustments.
My Own ValuationMagna (MG) suffers from such a volatile industry, but more so due to their heavy investment in EV adoption. They may have taken the step a bit too early with their investments that now they are feeling the pain in volume shortfalls. The bankruptcy of Fisker cost MG about $400 million in sales relative to their expectations at the start of 2024.

Otherwise, it is a great manager in maintaining optimal cost levels to minimize the negative impact on revenue. Because of this, it is highly shareholder-friendly, as the company embraces dividends and share repurchases. However, for any future stock gains, performance needs to improve. MG needs to overcome the substantial challenge they created for themselves. The image below illustrates what MG could have achieved without underwhelming investments in the EV transition and Fisker.

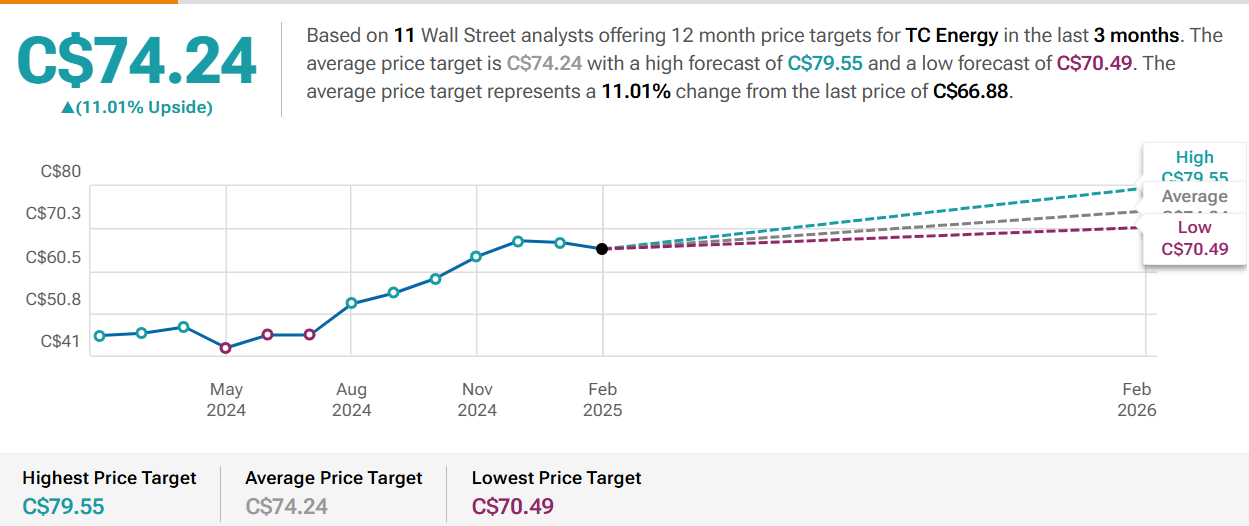
TC Energy (TRP)
Year-End Results*These numbers are slightly affected by the liquids business spin-off, South Bow Corp (SOBO). The spin-off allows TC Energy to concentrate on its natural gas and power generation projects.*
Revenues increased by 4%.
Earnings per share (EPS) increased by 61%. On a more normalized basis, the adjusted (or comparable) EPS decreased by 6%.
Dividends per share (DPS) decreased slightly, but this was due to the spin-off.
The payout ratio based on comparable earnings continues its slight ascension each year, rising to 87%.
Operating cash flow (OCF) totaled $7.7 billion, and free cash flow1 (FCF) amounted to $1.3 billion. The spin-off has helped reallocate capital.
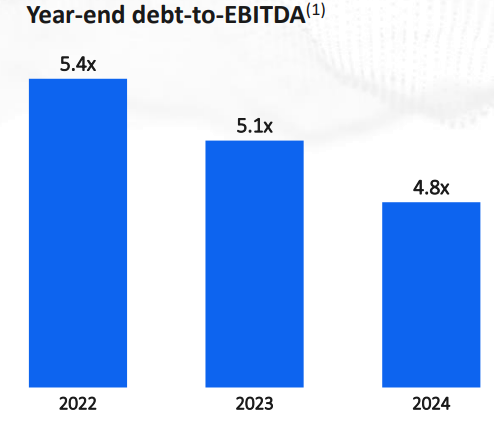
The long-term debt-to-equity ratio remains at 2.00, with a FCF to Debt of 0.02.
The annualized average growth rate of the share price was -3% over five years, -4% over three years, and +3% over the past year.
The number of outstanding shares remain largely unchanged.
Summary HighlightsMajor Project Execution
→ Southeast Gateway Pipeline: Achieved mechanical completion, with final cost tracking at ~$3.9 billion, 13% below the original estimate.
→ Plan México Goals: Includes attracting over US$270 billion in investments and increasing energy generation capacity.
Foreign Exchange Volatility: The company highlighted the impact of foreign exchange volatility, particularly with the weakening of the peso in Mexico. While they have hedging strategies in place, significant fluctuations could still pose a challenge.
Capital projects: Expected to support growth in areas such as LNG connectivity, power generation, and maintenance and modernization.
Dividend growth: Supported by operational excellence, aiming for 3 – 5% growth.
My Own ValuationTC Energy Corporation (TRP) is a major energy company that focuses on natural gas pipelines, liquids pipelines, and power generation. It has been on a run, and based on their performance, they may continue. In fact, energy should do really well if forecasted demands are met. They are also tariff protected. Ongoing trade negotiations between the U.S., Canada, and Mexico should not significantly impact TRP’s financial performance due to its regulated cost-of-service frameworks and long-term contracts.

The spin-off was also a positive move so now TRP can focus on its main attribute - natural gas. They are well positioned to take advantage of the energy demands that many say will be needed in the near future to power AI infrastructure.

Enbridge (ENB)
Year-End ResultsRevenues increased by 23%.
Earnings per share (EPS) decreased by 18%, but adjusted earnings increased by less than 1%. ENB’s take on this metric is through distributable cash flows (DCF) per share which increased by just over 1%.
Dividends per share (DPS) increased by 3%, marking the 30th consecutive annual increase.
The payout ratio was kept at a healthy percentage of 66%. This is in the company’s target range of 60-70%.
Operating cash flow (OCF) totaled $12.6 million, and free cash flow1 (FCF) amounted to $5.6 billion.
The net profit margin remains around its average of 10%.
The long-term debt-to-equity ratio keeps rising among higher debt levels to 1.41, with a FCF to Debt of 0.56.
The annualized average growth rate of the share price was +2% over five years, +3% over three years, and +5% over the past year.
The number of outstanding shares increased year-over-year.
Summary HighlightsUS Exposure: The company closed the acquisition of three major U.S. natural gas utilities creating the largest gas utility franchise in North America and added over $8 billion of organic projects to its backlog.
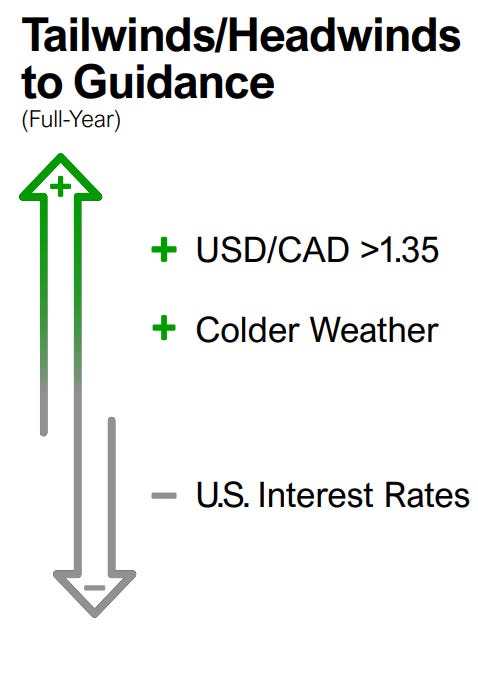
Tailwinds and Headwinds: If the US dollar continues to strengthen, or the Canadian dollar continues to weaken, ENB benefits. This could act like a hedge in your portfolio. As with every high capex company, higher interest rates will continue hurting cash flows.
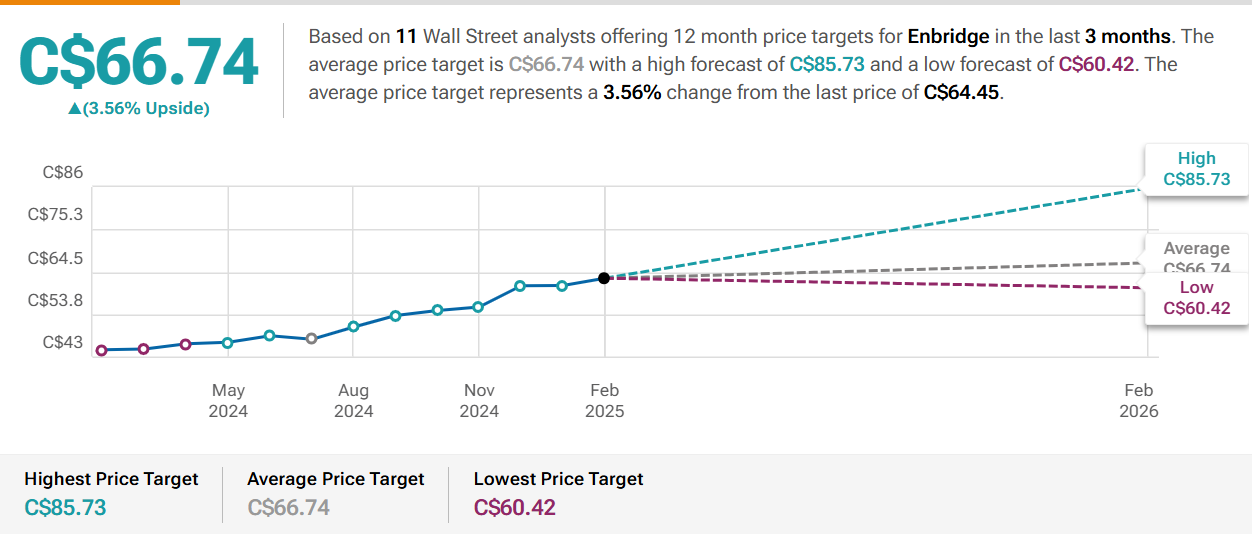
My Own ValuationDebt is not unfamiliar to ENB. Its capital-intensive nature requires substantial financing to drive growth. Ultimately, pipelines are essential for economies to function, as energy fuels the world. ENB holds a first-mover advantage with its extensive infrastructure for transporting energy goods throughout North America. Replicating this setup would require significant investment. Currently, ENB's stock price is near its all-time high, making further gains challenging. While the dividend is appealing for income investors, it may not be ideal for growth investors.

Fortis (FTS)
Year-End ResultsRevenues decreased by just under 1%.
Earnings per share (EPS) increased by 5%. On a normalized basis, adjusted EPS increased by 6%.
Dividends per share (DPS) increased by 4%, that is 51 consecutive years of dividend increases.
The payout ratio is being managed well at 74%. This is within the company’s target range of 65-80%.
Operating cash flow (OCF) totaled $3.8 billion, and free cash flow1 (FCF) was negative at $1.3 billion as a result of a capital-intensive industry.
The net profit margin landed around 15.9%.
The long-term debt-to-equity ratio hovers around 1.33.
The annualized average growth rate of the share price was +2% over five years, +1% over three years, and +2% over the past year.
The number of outstanding shares slightly increased.
Summary HighlightsCapital Plan 2025-29: $26 billion over five years.
→ Primary Focus: Virtually all investments are regulated, ensuring stable and predictable returns.
→ Rate Base Growth: Expected to grow at a compound annual growth rate (CAGR) of approximately 6.5%, from $39.0 billion in 2024 to $53.0 billion in 2029.
→ Investment-Grade Credit Ratings: Maintaining strong credit ratings to ensure access to capital at favorable rates.
Governance: Ranked #1 in governance by The Globe and Mail's Board Games for 2024, with strong board diversity and leadership.
Customer Affordability and Safety: Operating costs per customer increased by only 2.8% annually over the past five years, which is below inflation. Their teams achieved top quartile safety and reliability performance.
My Own ValuationFTS currently seems priced for perfection. Historically, the best time to buy FTS has been when it trades in the $50 range. This is a solid, long-standing company known for being the best dividend growth payer behind Canadian Utilities (CU). However, performance-wise, it has been outpaced by CU. The name of the game for this company is calm and steady—not exciting, but consistent.


CAPREIT (CAR.UN)
Year-End ResultsRevenues increased by 4%.
Funds from Operations (FFO) increased by 6%.
Dividends per share (DPS) increased by 1%.
The payout ratio based on FFO remained steady at 58%. Very healthy.
Operating cash flow (OCF) totaled $649 million, and free cash flow (FCF), or in other terms - adjusted funds from operations (AFFO), amounted to $429 million.
The net profit margin landed around 6%.
The long-term debt-to-equity ratio was 0.60, with a AFFO to Debt of 0.07.
The annualized average growth rate of the share price was -1% over five years, -5% over three years, and +1% over the past year.
The number of outstanding shares were reduced compared to prior year.
Summary HighlightsOperational Metrics:
→ The Canadian Residential Portfolio's occupancy rate slightly decreased to 97.5%, down from 98.8% in 2023.
→ Occupied Average Monthly Rent (AMR) in Canada increased to $1,636 from $1,516.
Balance Sheet:
→ Total debt to gross book value improved to 38.4% from 41.6% in 2023.
→ Cash and cash equivalents stood at $136.2 million at year-end.
Portfolio Repositioning:
→ Reduced the proportion of ancillary investments from 15% to 6%.
→ Identified and sold underperforming properties, focusing on newer, high-quality properties to enhance portfolio diversification and earnings.
→ Sold properties to non-profit organizations and affordable housing initiatives to help alleviate Canada's housing crisis.
My Own ValuationCAR.UN is one of the strongest REITs in Canada, making it an attractive option for income investors. Unfortunately, price growth has been lackluster. Despite persistent housing shortages, rent control has inhibited CAR.UN's growth. This may be one reason they have expanded into Europe, specifically the Netherlands. The dividend is very safe, and the price is attractive; however, if a recession hits, this REIT may be the first to crumble. Nonetheless, the necessity for shelter will always be there.


Net Income Growth: The spreadsheet presents a growth estimate that reflects the company's anticipated rise in net income for the upcoming five years, based on the average of projections from multiple analysts. The estimate is additionally adjusted down to reflect a more conservative approach.
Free Cash Flow to Equity (FCFE): This is calculated for several years, showing the amount of cash that could be distributed to shareholders after all expenses, reinvestment, and debt repayments.
Discounted Cash Flow (DCF) Valuation: The spreadsheet includes a DCF valuation section, which is a method used to estimate the value of an investment based on its expected future cash flows. It provides two valuation methods:
Perpetuity Growth: Calculated using a long-term growth rate and discounting future cash flows.
Exit Multiple: Based on an exit price-to-earnings (P/E) multiple, or price-to-FCFE multiple.
Current Share Price vs. DCF Value: A table compares the current share price of ATD with the estimated share price based on DCF valuation, suggesting whether the stock is undervalued or overvalued according to the model.
Disclaimer: The information provided in this valuation analysis is for educational and informational purposes only. It does not constitute financial advice or a recommendation to buy, sell, or hold any specific stocks or securities. The valuation model presented here relies on certain assumptions, including projected future cash flows and discount rates.
Other FY24 Reviews
This Month in Earnings - FY24 - February (Part 1)
·

Earnings Reviews include Waste Connections, Intact Financial, Toromont Industries, Canadian Tire, Telus, and CT REIT.


Consider joining DiviStock Chronicles’ Referral Program for more neat rewards!Please refer to the details of the referral program.