


This Month in Earnings - FY24 - February (Part 3)
Earnings Reviews include TFI International, CCL Industries, Wal-Mart, Emera, and Loblaw.

Welcome to my summary of earnings reports for fiscal 2024. As companies start to reveal their earnings for the fiscal year 2024, here are the results for stocks on my watch along with a business valuation. For additional context, please refer to my earlier post detailing my valuation methodology.

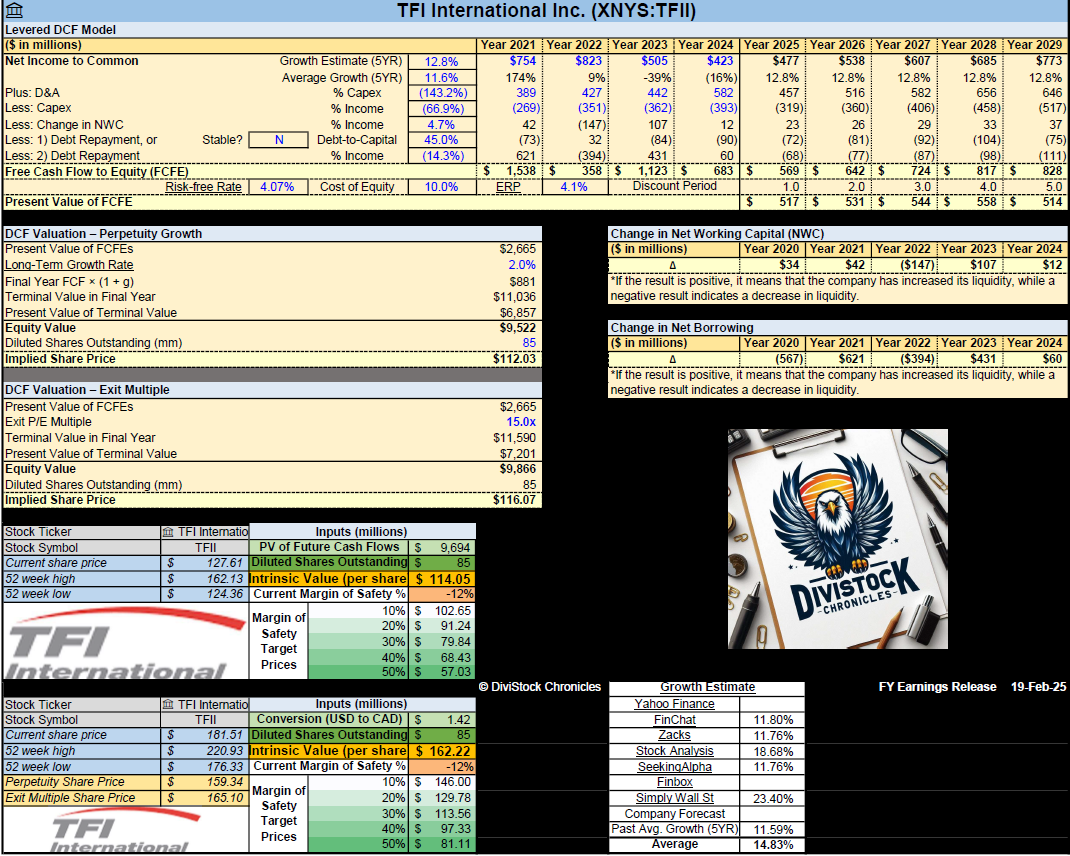
TFI International (TFII)
Year-End ResultsRevenues increased by 12%.
Earnings per share (EPS) decreased by 14%; while the adjusted EPS decreased by 7%.
Dividends per share (DPS) increased by 14%.
The payout ratio rose to 32% but remains healthy.
The net profit margin continues to fall around 5%.
Free Cash Flow was $768 million, down from $776 million in 2023.
The long-term debt-to-equity ratio climbed to 1.02, with a FCF to Debt of 0.25.
The annualized average growth rate of the share price was +37% over five years, +19% over three years, and +24% over the past year.
The number of outstanding shares remain largely unchanged.
Summary HighlightsAcquisition Monster: TFI's best-in-class operating margins, free cash flow yield, and conversion were highlighted, including a 9.8% operating margin and 80.6% FCF conversion. It has completed 95 acquisitions since 2015, five of which were major acquisitions.
Excellent Diversification: TFI has built a robust and well-diversified revenue base across different geographies and industries, with no client accounting for more than 5% of consolidated revenue.
Segment Highlights: The decrease in operating income for TFI International's Less-Than-Truckload and Logistics segments can be attributed to weaker market demand and higher accident-related expenses. Specifically, the Less-Than-Truckload segment recorded $8.0 million more in accident-related expenses compared to the prior year period
→ Truckload: Total revenue up 64% due to the acquisition of Daseke. Operating income increased by 18%.
→ Less-Than-Truckload: Total revenue declined by 13%. Operating income decreased by 34%.
→ Logistics: Total revenue declined by 14%. Operating income decreased by 22%.
Moving away from Canada: Plan to redomicile TFII from Canada to the U.S. to align with shareholder base and commercial presence. Redomiciling to the U.S. could align TFII more closely with its shareholder base, potentially making it easier to attract U.S. investors and access capital markets. TFII’s business is now today about 70% U. S. Domestic, 25% Canadian domestic and about 3% or 4% or 5% transborder.
My Own ValuationTFI International is a diversified full-service transport and logistics company operating across North America. TFI aims to create transportation and supply chain advantages by reducing delivery costs, improving efficiency and delivery timing, and driving satisfaction for the end consumer.
Its growth through acquisitions has notably bolstered the stock price, leading to a dramatic climb over the past five years. However, the inherent burden of debt that comes with these acquisitions poses a challenge for the company moving forward. This year will test its volatility, especially as it trades at a premium while continuing to expand (I wrote this before the earnings call which led to the massive drawback, so I was right). While further growth and the development of synergies are likely, the company must tread carefully with its financing strategies.
The decision to redomicile to the U.S. is a strategic one. Once U.S. shareholders own more than 50% of the company, it faces more burdensome reporting requirements if it remains domiciled outside the U.S. Being U.S.-domiciled allows the company to be included in various stock indices for which it would otherwise be ineligible. Additionally, it simplifies the renewal of U.S. military contracts, which TFI International obtained through its acquisition of Daseke. While the company's poor performance contributed to the 20% drop after announcing earnings, this decline was also likely influenced by the ownership of the second largest public pension plan in Canada, which has a mandate to generate returns while also supporting Quebec’s economic development.
This decision is indeed a positive step for TFII in my opinion, though it may be a setback for Canada as it highlights how less open it is for business. Consequently, TFII's stock price has reached a more reasonable level, presenting a potential opportunity for the future. However, management still needs to shape up after the CEO openly admitted the last quarter was a “DISASTER”! It was one of the direst conference calls I have ever recalled.

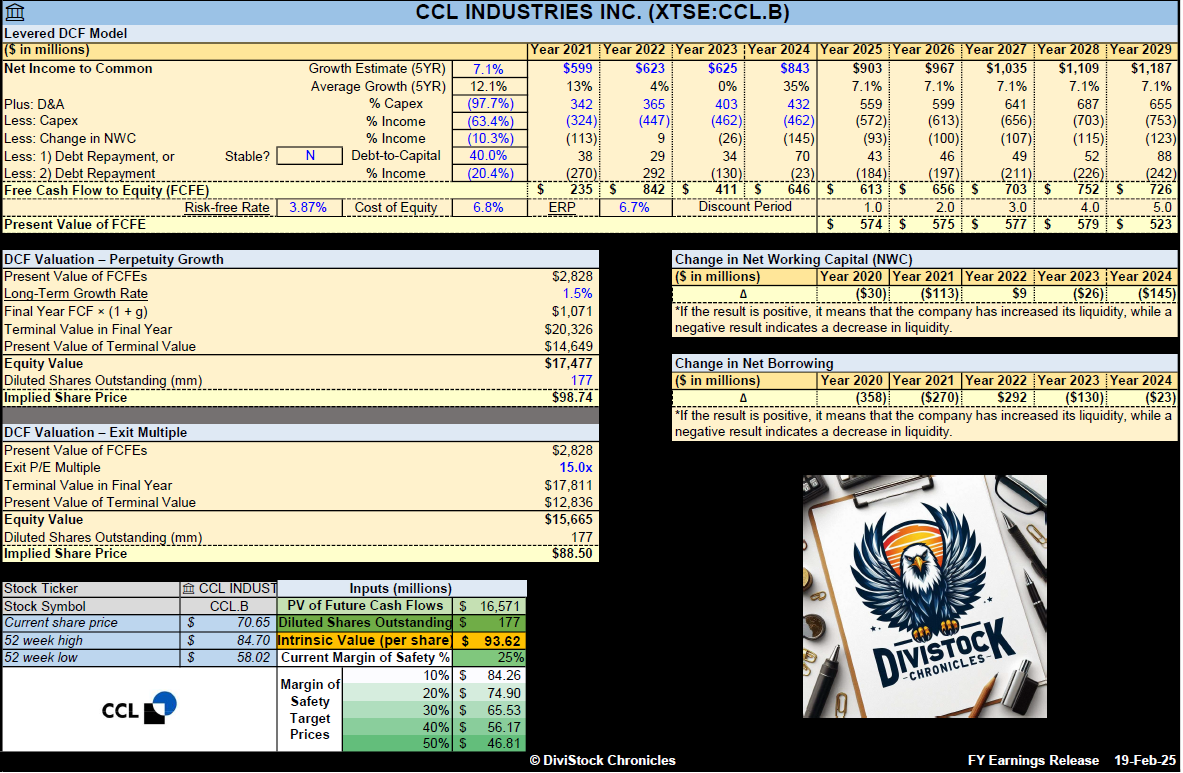
CCL Industries (CCL.B)
Year-End ResultsRevenues increased by 9%.
Earnings per share (EPS) increased by 59%. On a more normalized basis, the adjusted EPS increased by 15%.
Dividends per share (DPS) increased by 9%.
The payout ratio of 25% is an outstanding measure for any company.
The net profit margin improved to 11.6%.
The long-term debt-to-equity ratio is remarkable at 0.45, with a FCF to Debt of 0.25.
The annualized average growth rate of the share price was +5% over five years, +2% over three years, and +17% over the past year.
The number of outstanding shares slightly fell.
Summary HighlightsSales: Increased by 9.0%, driven by 6.8% organic growth, 1.4% acquisition growth, and 0.8% positive currency translation. That is outstanding organic growth!
Segment Performance
→ CCL Segment: Sales up 8.2%, organic growth 5.4%. Operating income up 7.6%, with a 14.9% operating margin.
→ Avery: Sales down 1.0%, organic decline 2.0%. Operating income down 6.9%, with an 18.6% operating margin.
→ Checkpoint: Sales up 13.6%, organic growth 13.3%. Operating income down 8.6%, with a 14.6% operating margin.
→ Innovia: Sales up 23.8%, organic growth 20.2%. Operating income up 103.7%, with a 9.3% operating margin.
Impact of Tariffs: Tariffs may not affect CCL particularly in a big way because they’re more of a local-to-local supplier, but their customers may be forced into a lot of decisions that could be quite disruptive.
My Own ValuationThis was one of the best performances for an underrated Canadian stock. Their impressive organic growth is only rivaled by their exceptional balance sheet management. This would enable them to continue acquiring synergetic companies. If the projected growth is realized, purchasing this stock in the low $70s appears to be a bargain.
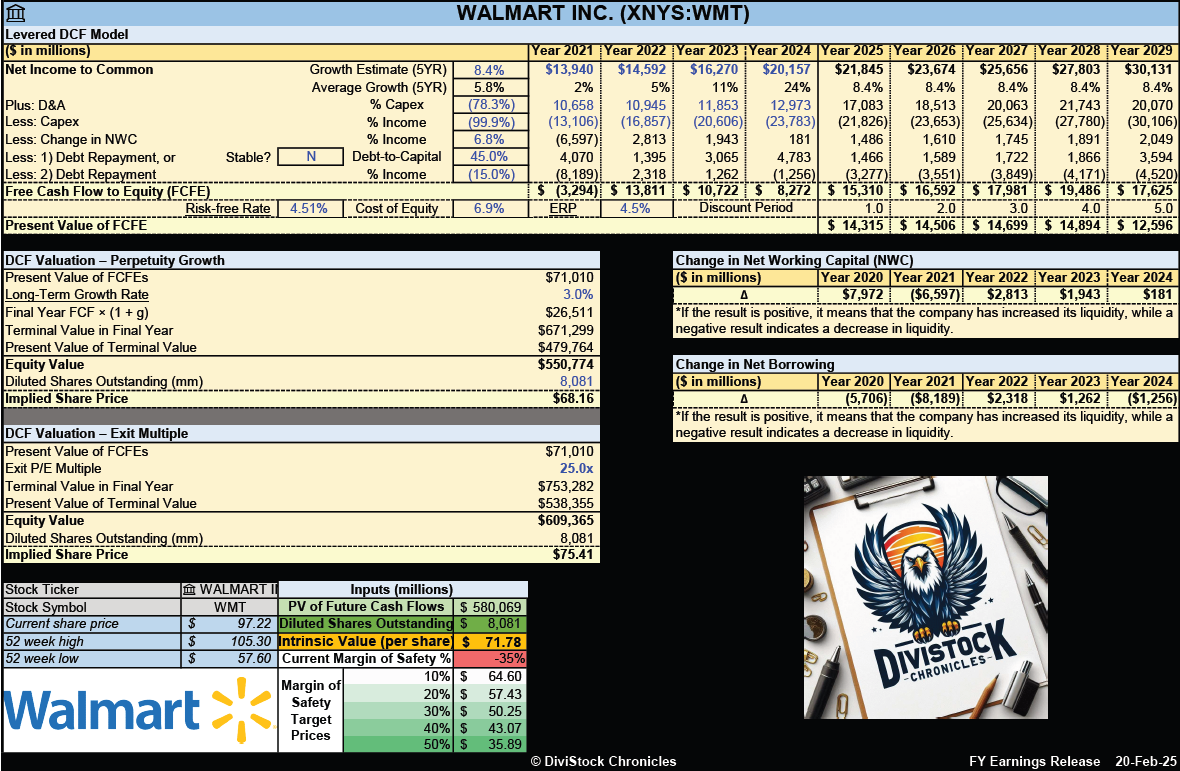
Wal-Mart (WMT)
Year-End ResultsRevenues increased by 5%.
Earnings per share (EPS) increased by 26%, and adjusted earnings increased by 13%.
Dividends per share (DPS) increased by 9%.
The payout ratio was kept at a healthy percentage of 34%.
The net profit margin remains around 2.9%.
The long-term debt-to-equity ratio is held respectably at 0.53, with a FCF to Debt of 0.22.
The annualized average growth rate of the share price was +15% over five years, +16% over three years, and +43% over the past year.
The number of outstanding shares decreased year-over-year.
Summary HighlightsSegment Highlights: E-commerce is still dominating! Walmart's global e-commerce penetration is now 18% of sales.
→ Walmart U.S.: Net sales were $123.5 billion, a 5.0% increase, with eCommerce growing by 20%.
→ Walmart International: Net sales were $34.3 billion, a 5.7% increase.
→ Sam’s Club U.S.: Net sales were $23.1 billion, a 5.7% increase, with eCommerce growing by 24%.
Omnichannel Capabilities: Introduction of AI agents like Wall E for inventory management, and new coding assistance tools. Investments in supply chain automation and faster delivery solutions.
Maintaining Low Prices: This presents a challenge for WMT. The company continues to invest in lowering prices and improving delivery speed. Balancing these investments with profitability remains a key challenge. While general merchandise consumables experienced deflationary pricing, food prices remained inflationary in the low single digits, affecting overall profitability.
My Own ValuationWMT is undoubtedly a great company. However, its stock has surged significantly over the past year with minimal pullbacks, despite the recent 7% dip following the earnings call. I was hesitant to buy in the mid $60s, so the current price is even more daunting. For WMT to deliver substantial returns for shareholders, it would need to significantly exceed earnings expectations at this point. The reality is that the consumer is more fragile than last year, and this situation isn't expected to improve.
A decent pullback can present an opportunity, but a retailer like WMT should not be trading at a 40 price-to-earnings (P/E) multiple. Once the stock settles, it is certainly a great company to hold for the long term. Only Costco does it better.

Emera (EMA)
Year-End ResultsRevenues decreased by 5%.
Earnings per share (EPS) decreased by 52%. The decline in reported net income was mainly driven by significant impairment charges, increased MTM losses, and other one-time charges, On a normalized basis, adjusted EPS decreased by 1%.
Dividends per share (DPS) increased by 3%.
The payout ratio has been elevated since 2019 and remains around 98% based on adjusted EPS. This is well out of the range of the company’s target range of 70-75%.
The net profit margin dropped to 6.9%.
The long-term debt-to-equity ratio hovers around 1.37.
The annualized average growth rate of the share price was -1% over five years, -5% over three years, and -6% over the past year.
The number of outstanding shares increased year-over-year.
Summary HighlightsSegment Performance:
→ Florida Electric Utility: Increased revenues due to customer growth and new base rates. Impacted by hurricane costs and timing of storm cost recovery.
→ Canadian Electric Utilities: Nova Scotia Power Inc. (NSPI) and NSP Maritime Link Inc. (NSPML) performance influenced by rate adjustments and storm cost recoveries.
→ Gas Utilities and Infrastructure: Increased earnings driven by new base rates and customer growth at Peoples Gas System (PGS).
→ Other Electric Utilities: Earnings increase due to higher sales volumes and lower operational expenses.
Florida Specific: Emera’s capital investment plan is forecasted to be approximately $20 billion from 2025 through 2029, focusing on reliability, system resiliency, infrastructure modernization, and integration of renewables. The majority of investments will be made in Florida utilities due to customer growth and system requirements.
My Own ValuationUtilities face enormous capital pressures to support their infrastructure, reliability, and growth. Emera cannot hide from it. It is certainly a play on Florida's economic growth and population increase. Following Florida’s strong economy, it has the fastest growing population in the USA. Approximately 62% of Emera's revenues come from Florida.
There is no worry as of yet. Emera is working to strengthen its balance sheet and credit ratings to reduce its cost of capital through a disciplined asset sales process and an optimized approach to capital allocation. But for dividend investors, there is one telling sign where this is headed as the payout ratio has not improved. Take it from management in the conference call, “Strategic reallocation of capital announced in June, including adjusting our dividend growth rate to 1% to 2% allows us to direct more of our growing cash flow towards our robust capital investment opportunities.” That dividend growth rate keeps dropping. Therefore, the capital investment decisions need to provide strong returns.


Loblaw Companies (L)
Year-End ResultsRevenues increased by 2%.
Earnings per share (EPS) increased by 7%, and adjusted earnings increased by 10%.
Dividends per share (DPS) increased by 14%.
The payout ratio was kept at a healthy percentage of 28%.
The net profit margin remains around 3.7%.
The long-term debt-to-equity ratio grew to 1.45 indicating a higher level of debt, with a FCF to Debt of 0.20.
The annualized average growth rate of the share price was +19% over five years, +25% over three years, and +36% over the past year.
The number of outstanding shares decreased year-over-year.
Summary HighlightsExpansion: Loblaw invested in its network by opening 52 new Drug and Food retail stores and 78 new pharmacy care clinics in 2024. Plans for 2025 include opening approximately 80 new food and drug stores, and 100 new clinics.
Same-Store Sales: The general trend observed higher customer traffic and tonnage growth in the food retail segment.
→ The company's food retail segment saw a reported same-store sales increase of 2.5%. This was influenced by several factors, including the shift in Thanksgiving, strong performance in their right-hand side business, and the elimination of multi-buy promotions.
→ The hard discount stores recorded double-digit growth in same-store sales. These stores continue to outperform conventional stores, demonstrating strong customer preference for discount offerings.
→ In the drug retail segment, absolute sales increased by 1.3%, and same-store sales also grew by 1.3%. Pharmacy and healthcare services within this segment showed even stronger performance, with a same-store sales growth of 6.3%. However, front store same-store sales declined by 3.1%, primarily due to the month-long Canada Post strike and the company's decision to exit low-margin electronics categories.
Tariff Impact: Produce will be the most impacted by any application of tariffs. However, other products can be mitigated through their strong control brand portfolio of No Name and PC brand items.
My Own ValuationLoblaw is the best chain in Canada by far, sorry Metro. It has seen unprecedented growth over the years. However, its debt levels are also growing which is something to keep an eye on. Loblaw operates in an oligopolistic market structure. This means that a few large firms dominate the market, and they have significant control over prices and market share. Loblaw, being one of the largest grocery retailers in Canada, holds a significant market share and competes closely with other major players. The presence of these few dominant firms creates an environment where competition is limited, and can be seen as a prominent advantage.


Net Income Growth: The spreadsheet presents a growth estimate that reflects the company's anticipated rise in net income for the upcoming five years, based on the average of projections from multiple analysts. The estimate is additionally adjusted down to reflect a more conservative approach.
Free Cash Flow to Equity (FCFE): This is calculated for several years, showing the amount of cash that could be distributed to shareholders after all expenses, reinvestment, and debt repayments.
Discounted Cash Flow (DCF) Valuation: The spreadsheet includes a DCF valuation section, which is a method used to estimate the value of an investment based on its expected future cash flows. It provides two valuation methods:
Perpetuity Growth: Calculated using a long-term growth rate and discounting future cash flows.
Exit Multiple: Based on an exit price-to-earnings (P/E) multiple, or price-to-FCFE multiple.
Current Share Price vs. DCF Value: A table compares the current share price of ATD with the estimated share price based on DCF valuation, suggesting whether the stock is undervalued or overvalued according to the model.
Disclaimer: The information provided in this valuation analysis is for educational and informational purposes only. It does not constitute financial advice or a recommendation to buy, sell, or hold any specific stocks or securities. The valuation model presented here relies on certain assumptions, including projected future cash flows and discount rates.
Other FY24 Reviews
This Month in Earnings - FY24 - February (Part 2)
·

Earnings Reviews include Magna International, TC Energy, Enbridge, Fortis, and CAPREIT.
This Month in Earnings - FY24 - February (Part 1)
·

Earnings Reviews include Waste Connections, Intact Financial, Toromont Industries, Canadian Tire, Telus, and CT REIT.


Consider joining DiviStock Chronicles’ Referral Program for more neat rewards!Please refer to the details of the referral program.