Canadian Natural Resources - Low Cost Structure - FY24
As companies start to reveal their earnings for the fiscal year 2024, here are the results for a stock in my portfolio along with a business valuation.
Welcome to my summary of Canadian Natural Resources’ ($CNQ) earnings report for fiscal 2024. For additional context, please refer to my earlier post detailing my valuation methodology.
Year-End Results
Canadian Natural Resources (CNQ) delivered a performance that balanced expectations—it neither dazzled nor fell short. The year was characterized by a significant acquisition and a strong commitment to shareholders through share buybacks and dividend increases.
Where is CNQ headed?
Canadian Natural Resources () appears to be a buying opportunity at these levels, but there are several factors to consider.
Revenues decreased by 1%.
Earnings per share (EPS) decreased by 24%, while the adjusted EPS decreased by 11%.
Dividends per share (DPS) increased by 16%.
On an adjusted basis, the payout ratio rose to 62%.
The net profit margin went down to 17%.
The long-term debt-to-equity ratio elevated to 0.45 after significant capital investment with a FCF to Debt of 0.25. These levels are normal for this industry.
The annualized average growth rate of the share price was +21% over five years, +28% over three years, and +18% over the past year.
The number of outstanding shares decreased as a result of buybacks.
Investor Call Highlights
Low-Cost Structure. This is one of the key differentiators relative to CNQ’s peers. This encompasses a low breakeven, low operating costs, low maintenance capital and significant capital flexibility.
Record Production
Annual average production exceeded 1,363,000 BOE/d (barrels of oil equivalent per day), with record liquids production of over 1,006,000 bbl/d (barrel per day).
Synthetic Crude Oil (SCO) production reached record levels, with annual production at 472,000 bbl/d.
Thermal in situ production also hit a record of approximately 271,000 bbl/d.
Shareholder Friendly. Dividends increased by 16% year-over-year, marking the 25th consecutive year of increases. Total shareholder returns reached approximately $7.1 billion through dividends and share repurchases.
Chevron Asset Acquisition. Acquired interests in the Duvernay asset play and oil sands leases for CAD $9.16 billion. Expanded working interests, including a 90% stake in the Athabasca Oil Sands Project. As a result, long-term debt rose due to these acquisitions and investments.
Debt to Book Capitalization: Increased to 32.1%, still within the company's target range of 25-45%.
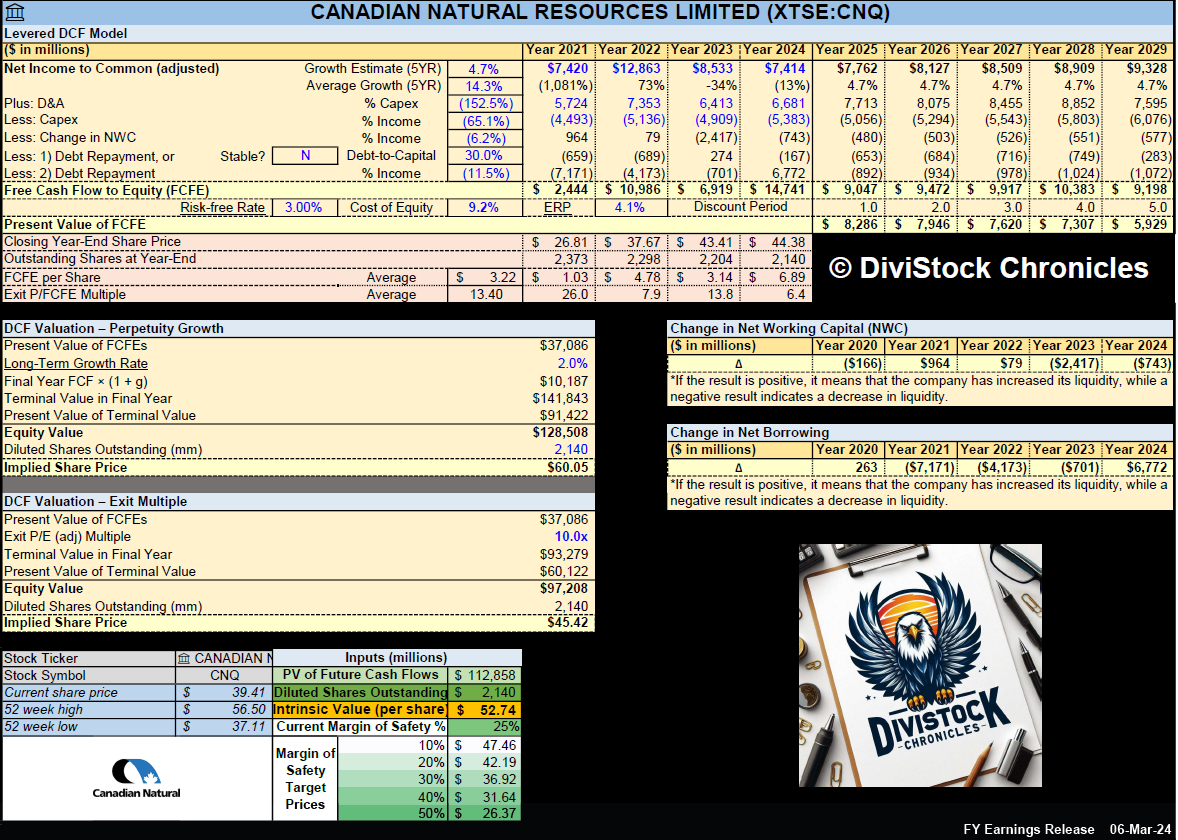
My Own Valuation
CNQ demonstrates a resilient financial profile despite volatility in net income, largely driven by fluctuations in energy prices and operational challenges. The peak in 2022 likely reflects a favorable commodity price environment, possibly due to geopolitical events like the Russia-Ukraine conflict, which drove oil prices higher. However, the subsequent decline in 2023 suggests a normalization of prices and increased operational costs.
The company’s strong cash flow generation, disciplined debt management, and possible undervaluation make it attractive for value investors. However, the energy sector is inherently volatile, with risks tied to oil and gas prices, environmental regulations, and geopolitical factors. The company’s focus on reducing debt and maintaining steady capex suggests a balanced approach to growth and financial stability.
Net Income Growth: The spreadsheet presents a growth estimate that reflects the company's anticipated rise in net income for the upcoming five years, based on the average of projections from multiple analysts. The estimate is additionally adjusted down to reflect a more conservative approach.
Free Cash Flow to Equity (FCFE): This is calculated for several years, showing the amount of cash that could be distributed to shareholders after all expenses, reinvestment, and debt repayments.
Discounted Cash Flow (DCF) Valuation: The spreadsheet includes a DCF valuation section, which is a method used to estimate the value of an investment based on its expected future cash flows. It provides two valuation methods:
Perpetuity Growth: Calculated using a long-term growth rate and discounting future cash flows.
Exit Multiple: Based on an exit price-to-earnings (P/E) multiple.
Current Share Price vs. DCF Value: A table compares the current share price of ATD with the estimated share price based on DCF valuation, suggesting whether the stock is undervalued or overvalued according to the model.
Disclaimer: The information provided in this valuation analysis is for educational and informational purposes only. It does not constitute financial advice or a recommendation to buy, sell, or hold any specific stocks or securities. The valuation model presented here relies on certain assumptions, including projected future cash flows and discount rates.
Other FY24 Reviews
Consider joining DiviStock Chronicles’ Referral Program for more neat rewards!Please refer to the details of the referral program.


