


This Month in Earnings - FY24 - February (Part 4)
Earnings Reviews include Home Depot, Stantec, Lowe's, Granite REIT, and Stella-Jones.

Welcome to my summary of earnings reports for fiscal 2024. As companies start to reveal their earnings for the fiscal year 2024, here are the results for stocks on my watch along with a business valuation. For additional context, please refer to my earlier post detailing my valuation methodology.

Home Depot (HD)
Year-End ResultsRevenues increased by 4%, while comparable revenues decreased by 1.8%.
Earnings per share (EPS) decreased by 1%; while the adjusted EPS decreased by just under 1%.
Dividends per share (DPS) increased by 8%.
The payout ratio rose to 60%, which is a tad higher than company policy of 55%.
The net profit margin remains around 9.3%.
The net debt-to-EBITDA ratio was 2.46, with a FCF to Debt of 0.26.
The annualized average growth rate of the share price was +12% over five years, +3% over three years, and +19% over the past year.
The number of outstanding shares continued to decline.
Summary HighlightsKey Achievements: Investments were made in the interconnected shopping experience, Pro wallet share growth, and new stores. Delivery speeds have improved significantly, and customer engagement has increased.
Expansionary: Opened twelve new stores in Fiscal 2024, with plans to open thirteen new stores in Fiscal 2025.
Average Spent per Customer: The company acknowledged the impact of inflation on their business, particularly in relation to core commodity categories like lumber and copper wire. Inflation in these categories positively impacted their average ticket by approximately 20 basis points. Additionally, the higher interest rate environment was noted as a factor that continues to pressure larger remodeling projects.
Focus on Dynamics: As homes continue to age and people stay in their homes longer, they are more likely to take on larger remodeling projects. This is especially true for those who are locked into lower interest rates or are not wanting to get new mortgages with higher rates. He also noted that there is a significant amount of equity built up in U.S. housing, which homeowners may eventually tap into for larger remodeling projects
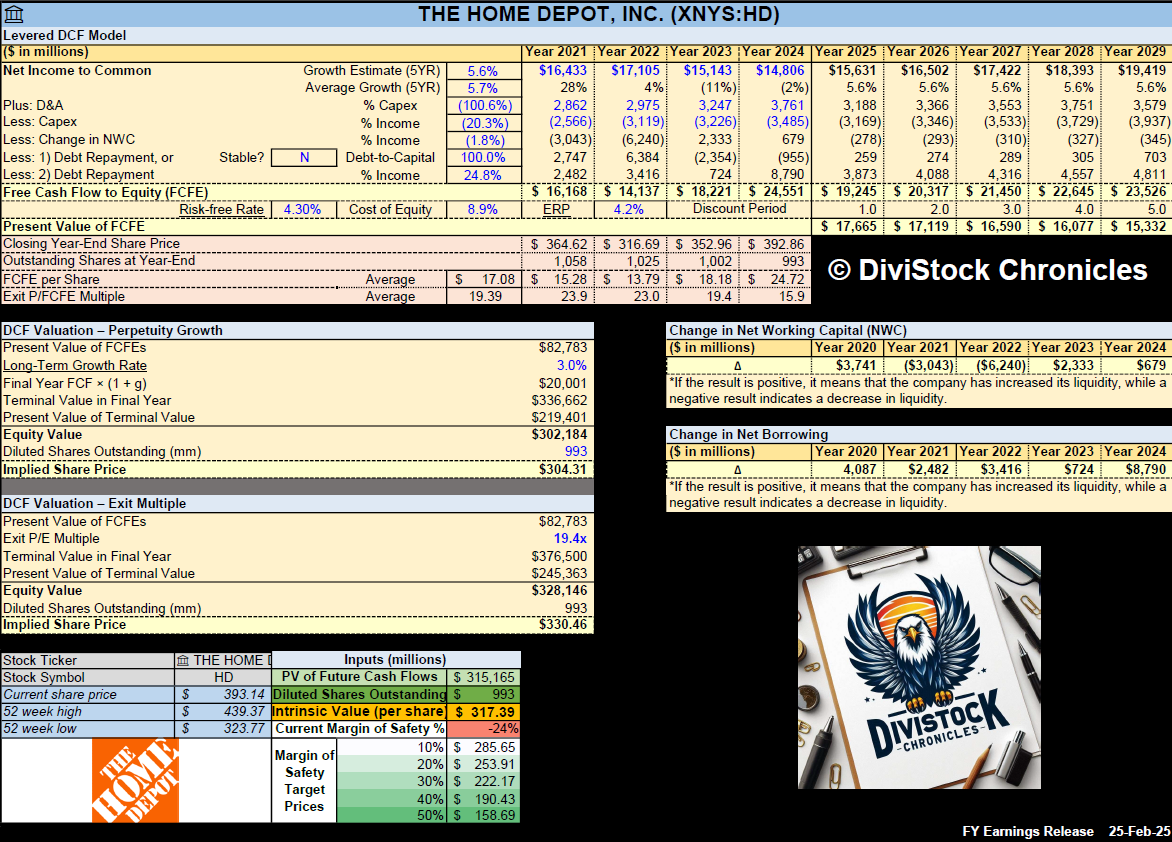
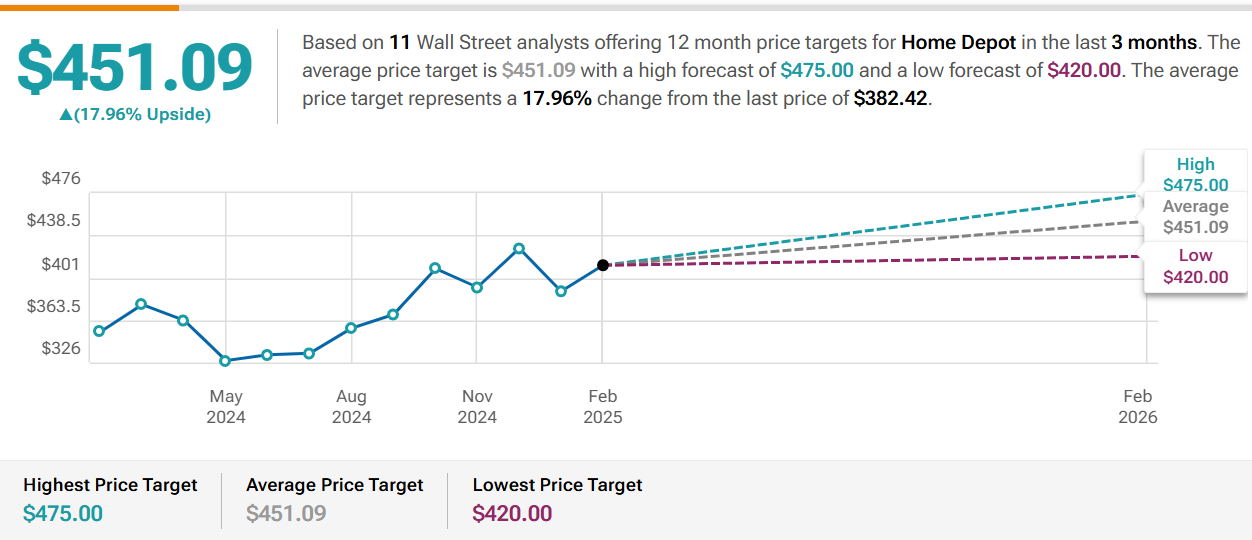
My Own ValuationAnalysts seem pretty bullish on HD, but I'm not as convinced. It's been on my wishlist for a while, but I haven't pulled the trigger due to its trading price. I understand HD deserves a premium for being a leader in its industry. It has also been pushed higher due to the California fires, which inevitably lead to rebuilds and remodeling projects that can only benefit HD.
HD is an excellent long-term play, but not so much during economic downturns. HD generates revenue through new home builds or renovation projects, benefiting from both ends of the spectrum. However, they thrive only when the economy is strong and consumers have plenty of disposable income.
Stantec (STN)
Year-End ResultsRevenues increased by 16%. This consisted of organic growth, 7.4%, and acquisition growth, 7.5%.
Earnings per share (EPS) increased by 11%. On a more normalized basis, the adjusted EPS increased by 20%.
Dividends per share (DPS) increased by 8%.
The payout ratio of 26% is an outstanding measure for any company.
The net profit margin improved to 6.2%.
The long-term debt-to-equity ratio is at 0.59, with a FCF to Debt of 0.25.
The annualized average growth rate of the share price was +29% over five years, +25% over three years, and +34% over the past year.
The number of outstanding remained pretty much on level terms.
Summary HighlightsRemarkable Organic Growth: Strong organic growth of 7.4% for the full year driven by 8.6% organic growth in the US, 6% in Canada, and 5.8% in Global.
Backlog Management: Managing a record backlog of $7.8 billion, which underscores the sustained demand for their services. This represents about 13 months of work.
Tariffs, No Sweat: One thing that management reflected on is that a lot of the segments that might be the most impacted aren't segments that STN are particularly active in, steel, aluminum, some of the big auto manufacturing and so on. Management sees that impact as minimal.
My Own ValuationJust a solid company all around. This may just be my third industrial stock to add to my portfolio behind WCN and CNR. The beauty of this page below from their presentation deck tells it all.

I'm seriously considering adding this stock to my portfolio. If there's any pullback after the recent post-earnings surge, it might be a perfect opportunity to pounce (or I may have missed it altogether). This looks like a great long-term hold.


Lowe’s (LOW)
Year-End ResultsRevenues decreased by 3%.
Earnings per share (EPS) decreased by 7%.
Dividends per share (DPS) increased by 3%, a much smaller increase than previous years.
The payout ratio was kept at a healthy percentage of 37%.
The net profit margin remains around 8%.
The net debt-to-EBITDA ratio was 3.25, with a FCF to Debt of 0.19.
The annualized average growth rate of the share price was +17% over five years, +5% over three years, and +15% over the past year.
The number of outstanding shares decreased year-over-year.
Summary HighlightsEconomic and Market Conditions: Despite short-term interest rates coming down, the home improvement market remains challenging due to high mortgage rates and a low pace of existing home sales.
Total Home Strategy: Lowe's refined their Total Home strategy, focusing on Pro penetration, accelerating online sales, expanding home services, creating a loyalty ecosystem, and increasing space productivity.
Bonuses: Lowe's awarded $80 million in discretionary bonuses to frontline associates in recognition of their hard work. A clear sign of their commitment to creating a up-beat morale amongst hard-working employees.
My Own ValuationVery similar outlook as with HD. I’ve recently highlighted both companies in a head-to-head battle which takes a deeper dive into both companies.
H2H Battle - Home Depot vs. Lowe's

The home improvement retail industry has experienced significant growth in recent years, driven by increased consumer spending on home renovations and DIY projects. This sector includes the sale of building materials, appliances, décor, and other home enhancements, as well as services provided by contractors and tradespeople. Major players in the U.S. m…
We have to understand though that recent economic data indicates a decline in U.S. consumer confidence and a potential resurgence of inflation, raising concerns about "stagflation" and further weakening demand for non-essential goods. These factors are pushing middle and low-income consumers to focus more on essential goods, which is expected to continue through 2025. It seems like hard times are ahead.


Granite REIT (GRT.UN)
Year-End ResultsRevenues increased by 9%.
The adjusted funds from operations (AFFO) is what REITs go by instead of earnings per share (EPS). It increased by 8%.
Dividends per share (DPS) increased by 3%.
The payout ratio improves to around 68% based on AFFO.
The net profit margin is around 63%.
The long-term debt-to-equity ratio hovers around 0.54. AFFO to total debt was 0.10. This is consistent with the company’s recent averages.
The annualized average growth rate of the share price was +3% over five years, -5% over three years, and -4% over the past year.
The number of outstanding shares remained largely unchanged.
Summary HighlightsMagna Exposure: Magna started in the GTA. It's been in operation here for over 65 years. Management does not anticipate that changing particularly given that production and supply chains take several years to establish and don't change over a period of months.
Tariff Impacts: More concern is placed on tenants in markets like London and Windsor, which cater specifically to cross-border distribution. However, the natural hedge provided by the U.S. portfolio against tariff concerns would result in a commensurate appreciation of the U.S. Dollar against the Canadian Dollar. This appreciation would increase Magna’s income from the U.S. portfolio, thereby boosting their overall income.
Ability to Sign Long-Term Leases: Signed a 12-year lease with a global consumer food product company for a $50.0 million development in Houston, Texas.
Landlord Rights: If leases are not fulfilled by a tenant, GRT.UN is protected through landlord rights on the function of a lease or transition of a lease to a new tenant. Therefore, a replacement of the credit is present.
Occupancy Dip: Target 95.5% to 96%, in that range for the end of 2025. Most of the expiries to occur over 2025 are in the U.S. Keep this in mind as the year progresses, as if it worsens, all REITs will suffer.

My Own ValuationIndustrial REITs generally trade at a premium to other REIT subsectors (e.g., office or retail) due to strong fundamentals. While the peak of REIT performance is behind us, as interest rates are unlikely to hover near 0% again, the quality of this REIT remains noteworthy. GRT.UN has been out of favor for a while, but its fundamentals remain strong. It’s challenging to stick with these, but for those seeking REIT exposure outside of residential and commercial sectors, this seems like a solid choice.
The resistance to this stock gaining traction is likely due to its exposure to Magna International, which holds 19% of GRT.UN’s gross leasable area. This is a significant reduction from its once 75% exposure. Another hindrance is Magna’s recent difficulties, compounded by potential tariff threats on the auto industry. If these factors dissipate, GRT.UN may finally thrive.


Stella-Jones (SJ)
Year-End ResultsRevenues increased by 5%.
Earnings per share (EPS) increased by 1%.
Dividends per share (DPS) increased by 22%.
The payout ratio was kept at a healthy percentage of 20%, which is within the company’s target range of 20-30%.
The net profit margin remains around 9%.
The long-term debt-to-equity ratio remained around 0.85, with a FCF to Debt of 0.16.
The annualized average growth rate of the share price was +15% over five years, +22% over three years, and +32% over the past year.
The number of outstanding shares slightly decreased.
Summary HighlightsProduct Category Performance
→ Utility Poles Sales: Increased from $1,571 million to $1,705 million (up 8.5%).
→ Railway Ties Sales: Increased from $828 million to $890 million (up 7.5%).
→ Residential Lumber Sales: Decreased from $645 million to $614 million (down 4.8%).
→ Industrial Products Sales: Increased from $148 million to $154 million (up 4.1%).
→ Logs and Lumber Sales: Decreased from $127 million to $106 million (down 16.5%).
Dividend Grower: Additionally, the company has increased its quarterly dividend by 11% to $0.31 per share, payable on April 18, 2025.
Utility Poles: Strong demand for pole replacement driven by aging infrastructure, grid resiliency, and energy transition. The company expects mid-single-digit volume growth in 2025.
Tariffs, Minimal: The potential exposure to tariffs is limited. Given our North American presence, the majority of SJ's products manufactured are sold domestically with minimal cross border transactions.
Acquisition Bids: They have always been a keystone of SJ's growth strategy. SJ is confident that in 2025, they can realize accretive acquisitions that will drive higher sales and profitability.
My Own ValuationSJ is a well-managed company that has benefited from recent acquisitions since the pandemic, propelling its stock price to new heights. However, it has faced some short-term challenges due to its rapid rise. Overall, it remains a healthy company with a well-managed balance sheet. Despite not receiving much attention from the market as a small player, SJ is fundamentally strong.
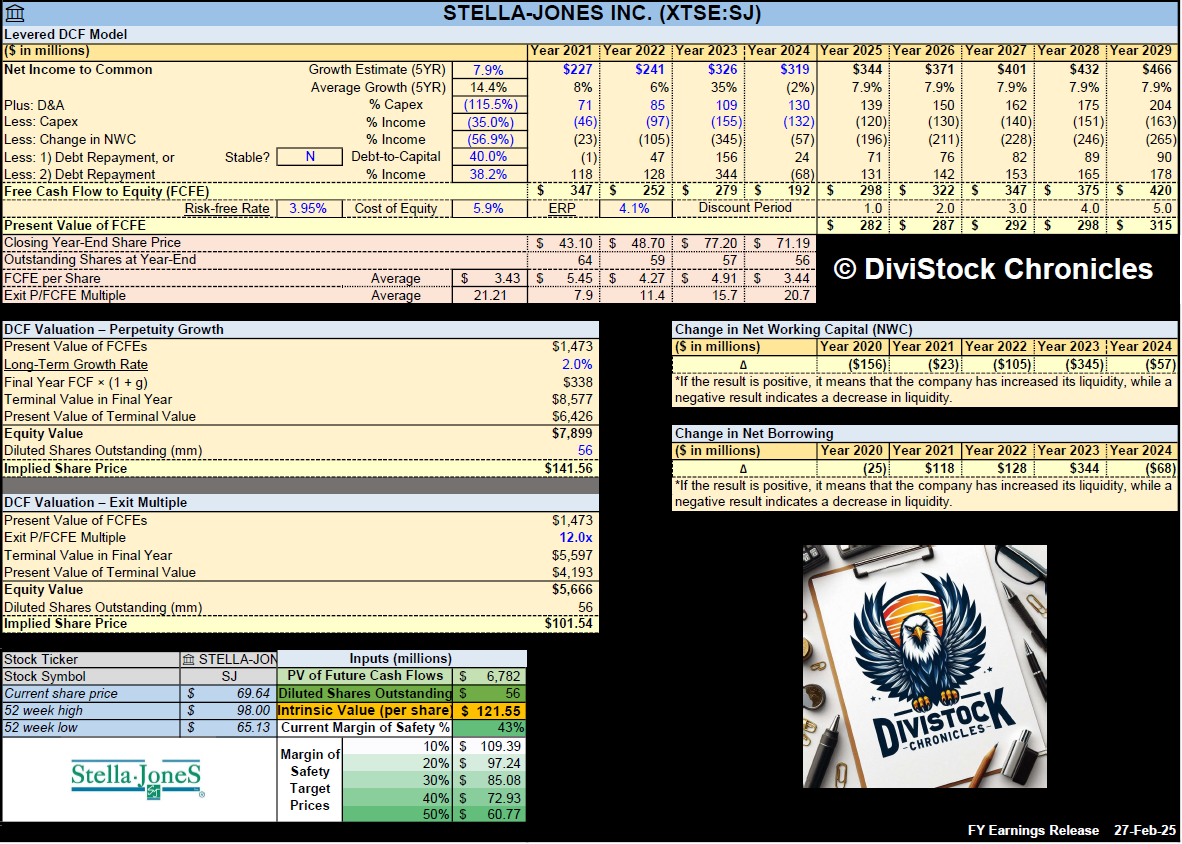

Net Income Growth: The spreadsheet presents a growth estimate that reflects the company's anticipated rise in net income for the upcoming five years, based on the average of projections from multiple analysts. The estimate is additionally adjusted down to reflect a more conservative approach.
Free Cash Flow to Equity (FCFE): This is calculated for several years, showing the amount of cash that could be distributed to shareholders after all expenses, reinvestment, and debt repayments.
Discounted Cash Flow (DCF) Valuation: The spreadsheet includes a DCF valuation section, which is a method used to estimate the value of an investment based on its expected future cash flows. It provides two valuation methods:
Perpetuity Growth: Calculated using a long-term growth rate and discounting future cash flows.
Exit Multiple: Based on an exit price-to-earnings (P/E) multiple, or price-to-FCFE multiple.
Current Share Price vs. DCF Value: A table compares the current share price of ATD with the estimated share price based on DCF valuation, suggesting whether the stock is undervalued or overvalued according to the model.
Disclaimer: The information provided in this valuation analysis is for educational and informational purposes only. It does not constitute financial advice or a recommendation to buy, sell, or hold any specific stocks or securities. The valuation model presented here relies on certain assumptions, including projected future cash flows and discount rates.
Other FY24 Reviews
This Month in Earnings - FY24 - February (Part 3)

Earnings Reviews include TFI International, CCL Industries, Wal-Mart, Emera, and Loblaw.
This Month in Earnings - FY24 - February (Part 2)

Earnings Reviews include Magna International, TC Energy, Enbridge, Fortis, and CAPREIT.
This Month in Earnings - FY24 - February (Part 1)

Earnings Reviews include Waste Connections, Intact Financial, Toromont Industries, Canadian Tire, Telus, and CT REIT.


Consider joining DiviStock Chronicles’ Referral Program for more neat rewards!Please refer to the details of the referral program.